
|
Armour Residential Reit, Inc. (ARR) Valeure DCF |
Entièrement Modifiable: Adapté À Vos Besoins Dans Excel Ou Sheets
Conception Professionnelle: Modèles Fiables Et Conformes Aux Normes Du Secteur
Pré-Construits Pour Une Utilisation Rapide Et Efficace
Compatible MAC/PC, entièrement débloqué
Aucune Expertise N'Est Requise; Facile À Suivre
ARMOUR Residential REIT, Inc. (ARR) Bundle
Explorez les perspectives financières d'Armor Residential REIT, Inc. (ARR) avec notre calculatrice DCF conviviale! Entrez vos hypothèses concernant la croissance, les marges et les dépenses pour déterminer la valeur intrinsèque de l'armure Residential REIT, Inc. (ARR) et façonnez vos décisions d'investissement.
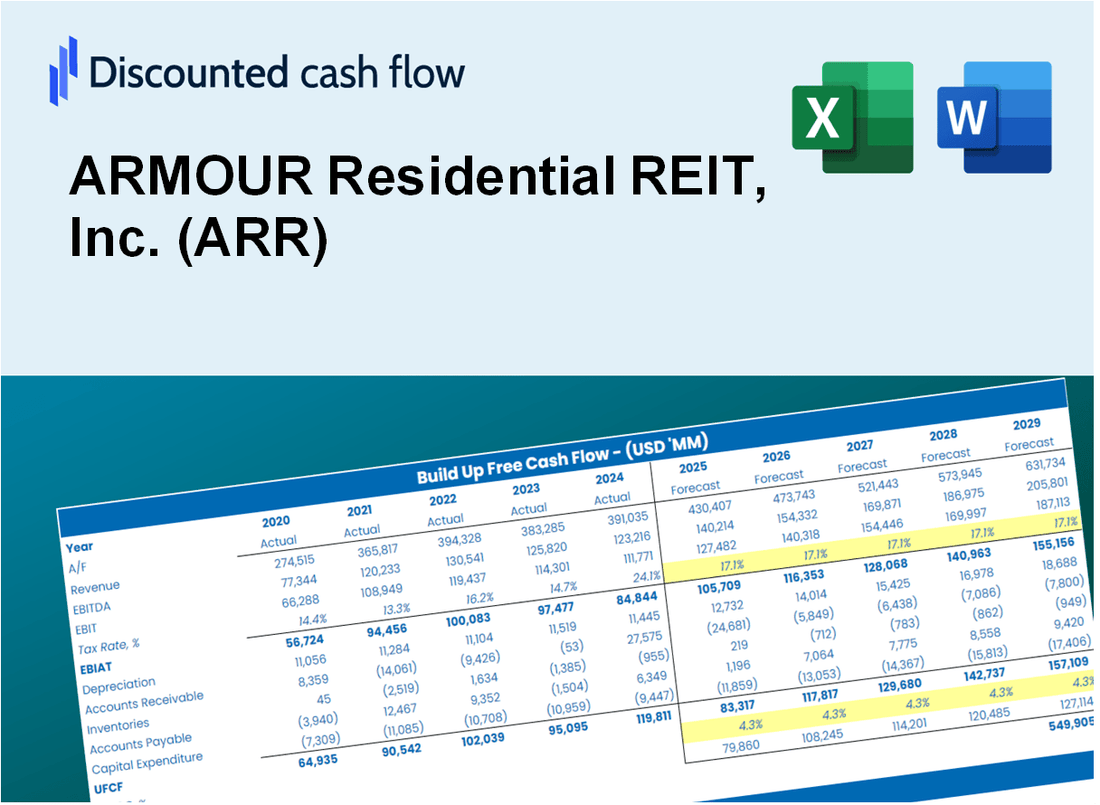
Discounted Cash Flow (DCF) - (USD MM)
| Year | AY1 2020 |
AY2 2021 |
AY3 2022 |
AY4 2023 |
AY5 2024 |
FY1 2025 |
FY2 2026 |
FY3 2027 |
FY4 2028 |
FY5 2029 |
|---|---|---|---|---|---|---|---|---|---|---|
| Revenue | -213.2 | 4.9 | -878.0 | 449.7 | 239.9 | 32.0 | 4.3 | .6 | .1 | .0 |
| Revenue Growth, % | 0 | -102.3 | -18039.4 | -151.22 | -46.65 | -86.66 | -86.66 | -86.66 | -86.66 | -86.66 |
| EBITDA | -151.1 | 7.1 | -104.6 | 457.9 | 510.1 | 24.5 | 3.3 | .4 | .1 | .0 |
| EBITDA, % | 70.88 | 145.28 | 11.91 | 101.82 | 212.63 | 76.56 | 76.56 | 76.56 | 76.56 | 76.56 |
| Depreciation | -62.1 | -17.6 | -773.0 | .0 | .3 | 1.1 | .1 | .0 | .0 | .0 |
| Depreciation, % | 29.12 | -359.19 | 88.05 | 0 | 0.14381 | 3.46 | 3.46 | 3.46 | 3.46 | 3.46 |
| EBIT | -89.0 | 24.7 | 668.4 | 457.9 | 509.8 | 17.0 | 2.3 | .3 | .0 | .0 |
| EBIT, % | 41.76 | 504.47 | -76.13 | 101.82 | 212.48 | 53.13 | 53.13 | 53.13 | 53.13 | 53.13 |
| Total Cash | 5,346.0 | 338.0 | 87.3 | 11,699.0 | 68.0 | 7.6 | 1.0 | .1 | .0 | .0 |
| Total Cash, percent | .0 | .0 | .0 | .0 | .0 | .0 | .0 | .0 | .0 | .0 |
| Account Receivables | 12.8 | 10.6 | 28.8 | 47.1 | 52.9 | 7.9 | 1.1 | .1 | .0 | .0 |
| Account Receivables, % | -6.02 | 215.98 | -3.28 | 10.48 | 22.04 | 24.64 | 24.64 | 24.64 | 24.64 | 24.64 |
| Inventories | -3,262.1 | .0 | -8,995.1 | .0 | .0 | 12.8 | 1.7 | .2 | .0 | .0 |
| Inventories, % | 1529.94 | 0 | 1024.55 | 0 | 0 | 40 | 40 | 40 | 40 | 40 |
| Accounts Payable | 4.2 | 3.7 | 28.9 | 38.3 | 40.6 | 6.1 | .8 | .1 | .0 | .0 |
| Accounts Payable, % | -1.97 | 75.01 | -3.29 | 8.51 | 16.93 | 19.04 | 19.04 | 19.04 | 19.04 | 19.04 |
| Capital Expenditure | .0 | .0 | .0 | .0 | .0 | .0 | .0 | .0 | .0 | .0 |
| Capital Expenditure, % | 0 | 0 | 0 | 0 | 0 | 0 | 0 | 0 | 0 | 0 |
| Tax Rate, % | 0 | 0 | 0 | 0 | 0 | 0 | 0 | 0 | 0 | 0 |
| EBITAT | -89.0 | 24.7 | 668.4 | 457.9 | 509.8 | 17.0 | 2.3 | .3 | .0 | .0 |
| Depreciation | ||||||||||
| Changes in Account Receivables | ||||||||||
| Changes in Inventories | ||||||||||
| Changes in Accounts Payable | ||||||||||
| Capital Expenditure | ||||||||||
| UFCF | 3,102.3 | -3,253.3 | 8,897.5 | -8,546.2 | 506.7 | 15.8 | 15.1 | 2.0 | .3 | .0 |
| WACC, % | 5.32 | 5.32 | 5.32 | 5.32 | 5.32 | 5.32 | 5.32 | 5.32 | 5.32 | 5.32 |
| PV UFCF | ||||||||||
| SUM PV UFCF | 30.5 | |||||||||
| Long Term Growth Rate, % | 2.00 | |||||||||
| Free cash flow (T + 1) | 0 | |||||||||
| Terminal Value | 1 | |||||||||
| Present Terminal Value | 1 | |||||||||
| Enterprise Value | 31 | |||||||||
| Net Debt | 10,647 | |||||||||
| Equity Value | -10,616 | |||||||||
| Diluted Shares Outstanding, MM | 52 | |||||||||
| Equity Value Per Share | -203.53 |
What You Will Get
- Comprehensive ARMOUR Data: Preloaded financials – covering metrics from revenue to net income – based on actual and projected figures.
- Full Customization: Modify all essential parameters (yellow cells) such as WACC, growth %, and tax rates.
- Instant Valuation Updates: Automatic recalculations to assess the effects of changes on ARMOUR's fair value.
- Flexible Excel Template: Designed for quick modifications, scenario analysis, and in-depth projections.
- Time-Saving and Accurate: Eliminate the need to build models from the ground up while ensuring precision and adaptability.
Key Features
- 🔍 Real-Life ARR Financials: Pre-filled historical and projected data for ARMOUR Residential REIT, Inc. (ARR).
- ✏️ Fully Customizable Inputs: Adjust all critical parameters (yellow cells) like WACC, growth %, and tax rates.
- 📊 Professional DCF Valuation: Built-in formulas calculate ARMOUR’s intrinsic value using the Discounted Cash Flow method.
- ⚡ Instant Results: Visualize ARMOUR’s valuation instantly after making changes.
- Scenario Analysis: Test and compare outcomes for various financial assumptions side-by-side.
How It Works
- Step 1: Download the Excel file for ARMOUR Residential REIT, Inc. (ARR).
- Step 2: Review the pre-filled financial data and forecasts specific to ARMOUR Residential REIT.
- Step 3: Adjust key inputs such as dividend yield, interest rates, and occupancy rates (highlighted cells).
- Step 4: Observe the DCF model refresh in real-time as you modify your assumptions.
- Step 5: Evaluate the results and leverage the insights for your investment strategies.
Why Choose This Calculator for ARMOUR Residential REIT, Inc. (ARR)?
- User-Friendly Interface: Suitable for both novice and experienced users.
- Customizable Inputs: Adjust parameters to fit your specific investment analysis.
- Real-Time Valuation: Instantly view changes in ARMOUR's valuation as you tweak the inputs.
- Preloaded Data: Comes with ARMOUR's actual financial metrics for immediate analysis.
- Relied Upon by Experts: A go-to tool for investors and analysts seeking informed insights.
Who Should Use This Product?
- Investors: Evaluate ARMOUR Residential REIT, Inc. (ARR) for informed investment decisions.
- CFOs and Financial Analysts: Optimize valuation methodologies and assess financial forecasts.
- Real Estate Professionals: Understand how residential REITs like ARMOUR are appraised in the market.
- Consultants: Provide clients with detailed valuation analyses and reports for REIT investments.
- Students and Educators: Utilize current market data to learn and teach valuation practices in real estate.
What the Template Contains
- Operating and Balance Sheet Data: Pre-filled ARMOUR Residential REIT, Inc. (ARR) historical data and forecasts, including revenue, EBITDA, EBIT, and capital expenditures.
- WACC Calculation: A dedicated sheet for Weighted Average Cost of Capital (WACC), featuring parameters like Beta, risk-free rate, and share price.
- DCF Valuation (Unlevered and Levered): Editable Discounted Cash Flow models that display intrinsic value with comprehensive calculations.
- Financial Statements: Pre-loaded financial statements (annual and quarterly) to facilitate thorough analysis.
- Key Ratios: Includes profitability, leverage, and efficiency ratios for ARMOUR Residential REIT, Inc. (ARR).
- Dashboard and Charts: Visual summary of valuation outputs and assumptions to simplify results analysis.
Disclaimer
All information, articles, and product details provided on this website are for general informational and educational purposes only. We do not claim any ownership over, nor do we intend to infringe upon, any trademarks, copyrights, logos, brand names, or other intellectual property mentioned or depicted on this site. Such intellectual property remains the property of its respective owners, and any references here are made solely for identification or informational purposes, without implying any affiliation, endorsement, or partnership.
We make no representations or warranties, express or implied, regarding the accuracy, completeness, or suitability of any content or products presented. Nothing on this website should be construed as legal, tax, investment, financial, medical, or other professional advice. In addition, no part of this site—including articles or product references—constitutes a solicitation, recommendation, endorsement, advertisement, or offer to buy or sell any securities, franchises, or other financial instruments, particularly in jurisdictions where such activity would be unlawful.
All content is of a general nature and may not address the specific circumstances of any individual or entity. It is not a substitute for professional advice or services. Any actions you take based on the information provided here are strictly at your own risk. You accept full responsibility for any decisions or outcomes arising from your use of this website and agree to release us from any liability in connection with your use of, or reliance upon, the content or products found herein.