
|
Athira Pharma, Inc. (ATHA) Valation DCF |
Entièrement Modifiable: Adapté À Vos Besoins Dans Excel Ou Sheets
Conception Professionnelle: Modèles Fiables Et Conformes Aux Normes Du Secteur
Pré-Construits Pour Une Utilisation Rapide Et Efficace
Compatible MAC/PC, entièrement débloqué
Aucune Expertise N'Est Requise; Facile À Suivre
Athira Pharma, Inc. (ATHA) Bundle
Vous cherchez à déterminer la valeur intrinsèque d'Athira Pharma, Inc.? Notre calculatrice ATHA DCF intègre des données à jour et des fonctionnalités de personnalisation approfondies, vous permettant d'affiner vos prévisions et d'améliorer vos décisions d'investissement.
What You Will Get
- Editable Excel Template: A fully customizable Excel-based DCF Calculator featuring pre-filled real ATHA financials.
- Real-World Data: Historical data and forward-looking estimates (highlighted in the yellow cells).
- Forecast Flexibility: Adjust forecast assumptions such as revenue growth, EBITDA %, and WACC.
- Automatic Calculations: Instantly observe the effect of your inputs on Athira Pharma’s valuation.
- Professional Tool: Designed for investors, CFOs, consultants, and financial analysts.
- User-Friendly Design: Organized for clarity and ease of use, accompanied by step-by-step instructions.
Key Features
- Comprehensive Financial Data: Gain access to precise pre-loaded historical performance and future forecasts for Athira Pharma, Inc. (ATHA).
- Adjustable Forecast Parameters: Modify highlighted cells for key metrics like WACC, growth rates, and profit margins.
- Real-Time Calculations: Automatic updates for DCF, Net Present Value (NPV), and cash flow assessments.
- User-Friendly Dashboard: Intuitive charts and summaries that clearly present your valuation findings.
- Suitable for All Levels: A straightforward, user-centric design tailored for investors, CFOs, and consultants alike.
How It Works
- Download the Template: Get instant access to the Excel-based ATHA DCF Calculator.
- Input Your Assumptions: Adjust yellow-highlighted cells for growth rates, WACC, margins, and more.
- Instant Calculations: The model automatically updates Athira Pharma’s intrinsic value.
- Test Scenarios: Simulate different assumptions to evaluate potential valuation changes.
- Analyze and Decide: Use the results to guide your investment or financial analysis.
Why Choose This Calculator for Athira Pharma, Inc. (ATHA)?
- Accuracy: Utilizes real Athira Pharma financials to ensure data precision.
- Flexibility: Crafted for users to easily test and modify their inputs.
- Time-Saving: Eliminate the need to build a DCF model from the ground up.
- Professional-Grade: Designed with CFO-level accuracy and user experience in mind.
- User-Friendly: Intuitive interface suitable for users without extensive financial modeling skills.
Who Should Use This Product?
- Individual Investors: Make informed decisions about buying or selling Athira Pharma, Inc. (ATHA) stock.
- Financial Analysts: Streamline valuation processes with ready-to-use financial models for Athira Pharma, Inc. (ATHA).
- Consultants: Deliver professional valuation insights on Athira Pharma, Inc. (ATHA) to clients quickly and accurately.
- Business Owners: Understand how biotech companies like Athira Pharma, Inc. (ATHA) are valued to guide your own strategy.
- Finance Students: Learn valuation techniques using real-world data and scenarios related to Athira Pharma, Inc. (ATHA).
What the Template Contains
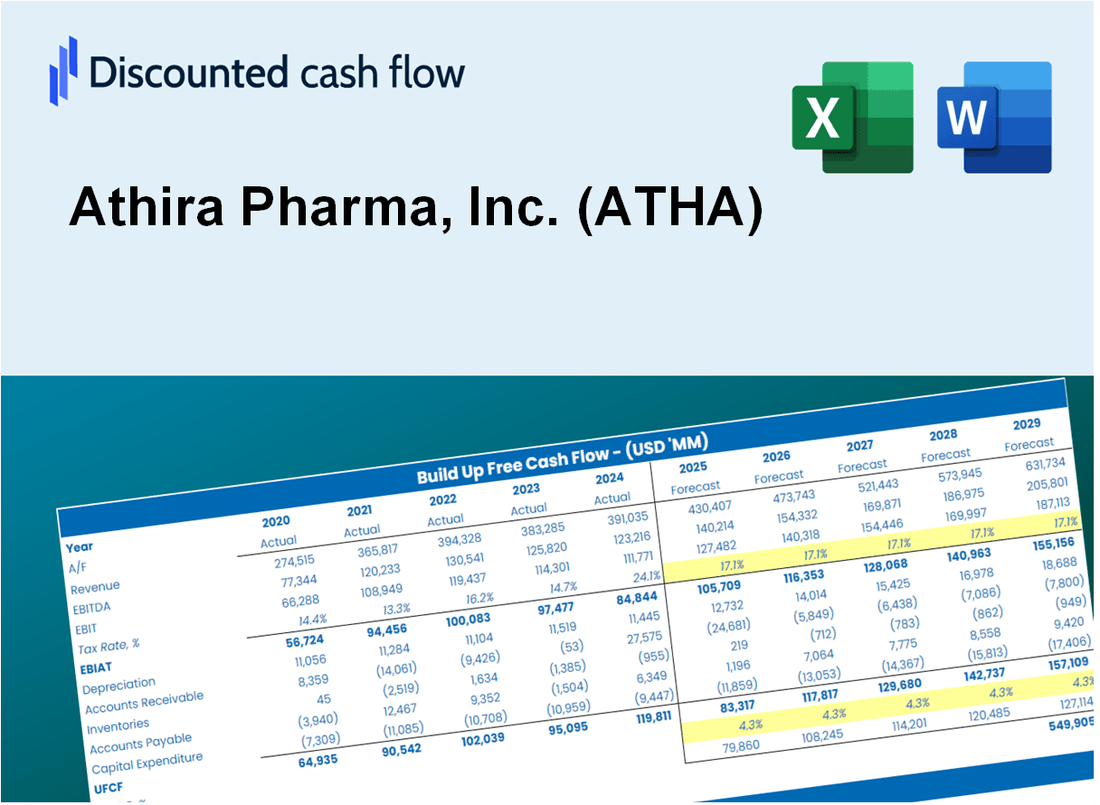
- Operating and Balance Sheet Data: Pre-filled Athira Pharma historical data and forecasts, including revenue, EBITDA, EBIT, and capital expenditures.
- WACC Calculation: A dedicated sheet for Weighted Average Cost of Capital (WACC), including parameters like Beta, risk-free rate, and share price.
- DCF Valuation (Unlevered and Levered): Editable Discounted Cash Flow models showing intrinsic value with detailed calculations.
- Financial Statements: Pre-loaded financial statements (annual and quarterly) to support analysis.
- Key Ratios: Includes profitability, leverage, and efficiency ratios for Athira Pharma, Inc. (ATHA).
- Dashboard and Charts: Visual summary of valuation outputs and assumptions to analyze results easily.
Disclaimer
All information, articles, and product details provided on this website are for general informational and educational purposes only. We do not claim any ownership over, nor do we intend to infringe upon, any trademarks, copyrights, logos, brand names, or other intellectual property mentioned or depicted on this site. Such intellectual property remains the property of its respective owners, and any references here are made solely for identification or informational purposes, without implying any affiliation, endorsement, or partnership.
We make no representations or warranties, express or implied, regarding the accuracy, completeness, or suitability of any content or products presented. Nothing on this website should be construed as legal, tax, investment, financial, medical, or other professional advice. In addition, no part of this site—including articles or product references—constitutes a solicitation, recommendation, endorsement, advertisement, or offer to buy or sell any securities, franchises, or other financial instruments, particularly in jurisdictions where such activity would be unlawful.
All content is of a general nature and may not address the specific circumstances of any individual or entity. It is not a substitute for professional advice or services. Any actions you take based on the information provided here are strictly at your own risk. You accept full responsibility for any decisions or outcomes arising from your use of this website and agree to release us from any liability in connection with your use of, or reliance upon, the content or products found herein.