
|
Adani Wilmar Limited (AWL.NS) Évaluation DCF |
Entièrement Modifiable: Adapté À Vos Besoins Dans Excel Ou Sheets
Conception Professionnelle: Modèles Fiables Et Conformes Aux Normes Du Secteur
Pré-Construits Pour Une Utilisation Rapide Et Efficace
Compatible MAC/PC, entièrement débloqué
Aucune Expertise N'Est Requise; Facile À Suivre
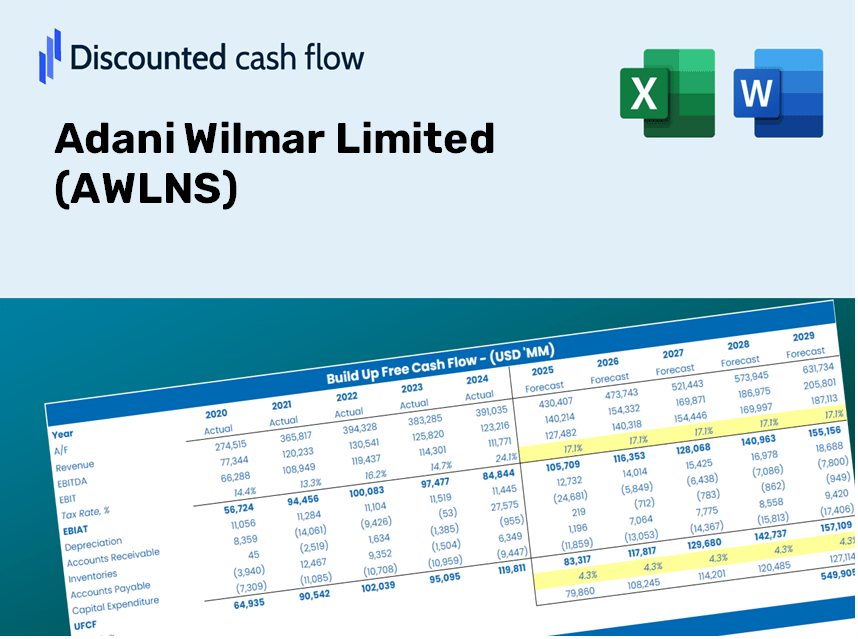
Adani Wilmar Limited (AWL.NS) Bundle
Conçu pour la précision, notre calculatrice DCF (AWLNS) vous permet d'évaluer l'évaluation d'Adani Wilmar Limited en utilisant des données financières réelles et offre une flexibilité complète pour modifier tous les paramètres essentiels pour des projections améliorées.
Discounted Cash Flow (DCF) - (USD MM)
| Year | AY1 2021 |
AY2 2022 |
AY3 2023 |
AY4 2024 |
AY5 2025 |
FY1 2026 |
FY2 2027 |
FY3 2028 |
FY4 2029 |
FY5 2030 |
|---|---|---|---|---|---|---|---|---|---|---|
| Revenue | 370,904.2 | 541,873.2 | 581,848.1 | 512,251.0 | 636,722.4 | 741,479.0 | 863,470.6 | 1,005,532.8 | 1,170,967.8 | 1,363,620.9 |
| Revenue Growth, % | 0 | 46.1 | 7.38 | -11.96 | 24.3 | 16.45 | 16.45 | 16.45 | 16.45 | 16.45 |
| EBITDA | 12,848.2 | 18,353.8 | 10,921.8 | 10,807.5 | 24,322.1 | 21,737.1 | 25,313.3 | 29,478.0 | 34,327.9 | 39,975.7 |
| EBITDA, % | 3.46 | 3.39 | 1.88 | 2.11 | 3.82 | 2.93 | 2.93 | 2.93 | 2.93 | 2.93 |
| Depreciation | 2,268.2 | 2,686.4 | 3,013.9 | 2,997.7 | 3,282.7 | 4,042.6 | 4,707.7 | 5,482.3 | 6,384.2 | 7,434.6 |
| Depreciation, % | 0.61153 | 0.49576 | 0.51799 | 0.5852 | 0.51556 | 0.54521 | 0.54521 | 0.54521 | 0.54521 | 0.54521 |
| EBIT | 10,580.0 | 15,667.4 | 7,907.9 | 7,809.8 | 21,039.4 | 17,694.4 | 20,605.6 | 23,995.8 | 27,943.7 | 32,541.1 |
| EBIT, % | 2.85 | 2.89 | 1.36 | 1.52 | 3.3 | 2.39 | 2.39 | 2.39 | 2.39 | 2.39 |
| Total Cash | 1,072.5 | 25,949.4 | 23,823.2 | 14,722.3 | 12,352.4 | 20,741.3 | 24,153.8 | 28,127.6 | 32,755.3 | 38,144.4 |
| Total Cash, percent | .0 | .0 | .0 | .0 | .0 | .0 | .0 | .0 | .0 | .0 |
| Account Receivables | 16,841.3 | 25,511.1 | 22,423.1 | 21,745.5 | 27,194.2 | 32,059.1 | 37,333.7 | 43,476.0 | 50,628.8 | 58,958.5 |
| Account Receivables, % | 4.54 | 4.71 | 3.85 | 4.25 | 4.27 | 4.32 | 4.32 | 4.32 | 4.32 | 4.32 |
| Inventories | 48,776.0 | 77,685.3 | 76,812.4 | 72,798.2 | 87,175.2 | 101,717.8 | 118,452.8 | 137,941.3 | 160,636.0 | 187,064.6 |
| Inventories, % | 13.15 | 14.34 | 13.2 | 14.21 | 13.69 | 13.72 | 13.72 | 13.72 | 13.72 | 13.72 |
| Accounts Payable | 47,440.0 | 15,811.5 | 21,105.0 | 28,186.2 | 29,557.1 | 43,717.6 | 50,910.3 | 59,286.3 | 69,040.3 | 80,399.2 |
| Accounts Payable, % | 12.79 | 2.92 | 3.63 | 5.5 | 4.64 | 5.9 | 5.9 | 5.9 | 5.9 | 5.9 |
| Capital Expenditure | -4,620.4 | -5,356.2 | -6,792.5 | -9,323.0 | -9,955.4 | -10,062.0 | -11,717.5 | -13,645.3 | -15,890.3 | -18,504.6 |
| Capital Expenditure, % | -1.25 | -0.98846 | -1.17 | -1.82 | -1.56 | -1.36 | -1.36 | -1.36 | -1.36 | -1.36 |
| Tax Rate, % | 26.34 | 26.34 | 26.34 | 26.34 | 26.34 | 26.34 | 26.34 | 26.34 | 26.34 | 26.34 |
| EBITAT | 9,266.5 | 11,572.4 | 5,631.2 | 4,820.9 | 15,497.2 | 13,024.7 | 15,167.6 | 17,663.1 | 20,569.1 | 23,953.2 |
| Depreciation | ||||||||||
| Changes in Account Receivables | ||||||||||
| Changes in Inventories | ||||||||||
| Changes in Accounts Payable | ||||||||||
| Capital Expenditure | ||||||||||
| UFCF | -11,262.9 | -60,305.0 | 11,107.0 | 10,268.6 | -9,630.3 | 1,758.3 | -6,659.1 | -7,754.7 | -9,030.6 | -10,516.3 |
| WACC, % | 6.13 | 5.86 | 5.81 | 5.63 | 5.86 | 5.86 | 5.86 | 5.86 | 5.86 | 5.86 |
| PV UFCF | ||||||||||
| SUM PV UFCF | -25,920.0 | |||||||||
| Long Term Growth Rate, % | 3.50 | |||||||||
| Free cash flow (T + 1) | -10,884 | |||||||||
| Terminal Value | -461,291 | |||||||||
| Present Terminal Value | -346,996 | |||||||||
| Enterprise Value | -372,916 | |||||||||
| Net Debt | -3,878 | |||||||||
| Equity Value | -369,038 | |||||||||
| Diluted Shares Outstanding, MM | 1,298 | |||||||||
| Equity Value Per Share | -284.37 |
What You Will Receive
- Authentic AWLNS Financial Data: Loaded with Adani Wilmar Limited’s historical and forecasted data for accurate analysis.
- Customizable Template: Easily adjust key parameters such as revenue growth, WACC, and EBITDA margin.
- Real-Time Calculations: Instantly view updates to Adani Wilmar Limited’s intrinsic value as you make changes.
- Professional Valuation Tool: Tailored for investors, analysts, and consultants aiming for precise DCF outcomes.
- Intuitive Design: Straightforward layout and clear guidance suitable for users of all skill levels.
Key Features of Adani Wilmar Limited (AWLNS)
- Comprehensive Financial Data: Gain access to reliable historical data and future forecasts tailored for Adani Wilmar Limited (AWLNS).
- Adjustable Forecast Parameters: Modify highlighted cells for WACC, growth rates, and profit margins as needed.
- Real-Time Calculations: Enjoy automatic updates for DCF, Net Present Value (NPV), and cash flow assessments.
- Interactive Visualization Tools: Utilize clear charts and summaries to effectively represent your valuation insights.
- Suitable for All Users: Designed with an intuitive layout catering to both novice and experienced investors, CFOs, and consultants.
How It Functions
- Step 1: Download the ready-made Excel template featuring Adani Wilmar Limited’s (AWLNS) data.
- Step 2: Navigate through the pre-filled sheets to familiarize yourself with the essential metrics.
- Step 3: Modify forecasts and assumptions in the editable highlighted cells (WACC, growth, margins).
- Step 4: Immediately view the updated results, including Adani Wilmar Limited's (AWLNS) intrinsic value.
- Step 5: Use the insights gained to make informed investment choices or compile reports based on the outputs.
Why Select the Adani Wilmar Limited (AWLNS) Calculator?
- Save Time: Skip the hassle of building a DCF model from the ground up – it’s readily available.
- Enhance Accuracy: Dependable financial data and formulas minimize valuation errors.
- Completely Customizable: Modify the model to align with your specific assumptions and forecasts.
- Intuitive Interpretation: User-friendly charts and outputs simplify result analysis.
- Favored by Professionals: Crafted for experts who prioritize accuracy and ease of use.
Who Can Benefit from This Product?
- Finance Students: Master valuation methods and practice with actual data related to Adani Wilmar Limited (AWLNS).
- Academics: Integrate industry-standard models into your curricula or research projects.
- Investors: Validate your investment hypotheses and evaluate the valuation metrics for Adani Wilmar Limited (AWLNS).
- Analysts: Enhance your productivity with a ready-to-use, customizable DCF model tailored for Adani Wilmar Limited (AWLNS).
- Small Business Owners: Understand the analytical processes applied to large public enterprises like Adani Wilmar Limited (AWLNS).
Contents of the Template
- Pre-Filled Data: Features Adani Wilmar Limited’s historical financials and projections.
- Discounted Cash Flow Model: An editable DCF valuation model with automatic calculations.
- Weighted Average Cost of Capital (WACC): A dedicated sheet for WACC calculations based on your custom inputs.
- Key Financial Ratios: Assess Adani Wilmar’s profitability, efficiency, and financial leverage.
- Customizable Inputs: Easily edit revenue growth, margins, and tax rates.
- Clear Dashboard: Visual summaries with charts and tables highlighting key valuation results.
Disclaimer
All information, articles, and product details provided on this website are for general informational and educational purposes only. We do not claim any ownership over, nor do we intend to infringe upon, any trademarks, copyrights, logos, brand names, or other intellectual property mentioned or depicted on this site. Such intellectual property remains the property of its respective owners, and any references here are made solely for identification or informational purposes, without implying any affiliation, endorsement, or partnership.
We make no representations or warranties, express or implied, regarding the accuracy, completeness, or suitability of any content or products presented. Nothing on this website should be construed as legal, tax, investment, financial, medical, or other professional advice. In addition, no part of this site—including articles or product references—constitutes a solicitation, recommendation, endorsement, advertisement, or offer to buy or sell any securities, franchises, or other financial instruments, particularly in jurisdictions where such activity would be unlawful.
All content is of a general nature and may not address the specific circumstances of any individual or entity. It is not a substitute for professional advice or services. Any actions you take based on the information provided here are strictly at your own risk. You accept full responsibility for any decisions or outcomes arising from your use of this website and agree to release us from any liability in connection with your use of, or reliance upon, the content or products found herein.