
|
Axsome Therapeutics, Inc. (AXSM) Évaluation DCF |
Entièrement Modifiable: Adapté À Vos Besoins Dans Excel Ou Sheets
Conception Professionnelle: Modèles Fiables Et Conformes Aux Normes Du Secteur
Pré-Construits Pour Une Utilisation Rapide Et Efficace
Compatible MAC/PC, entièrement débloqué
Aucune Expertise N'Est Requise; Facile À Suivre
Axsome Therapeutics, Inc. (AXSM) Bundle
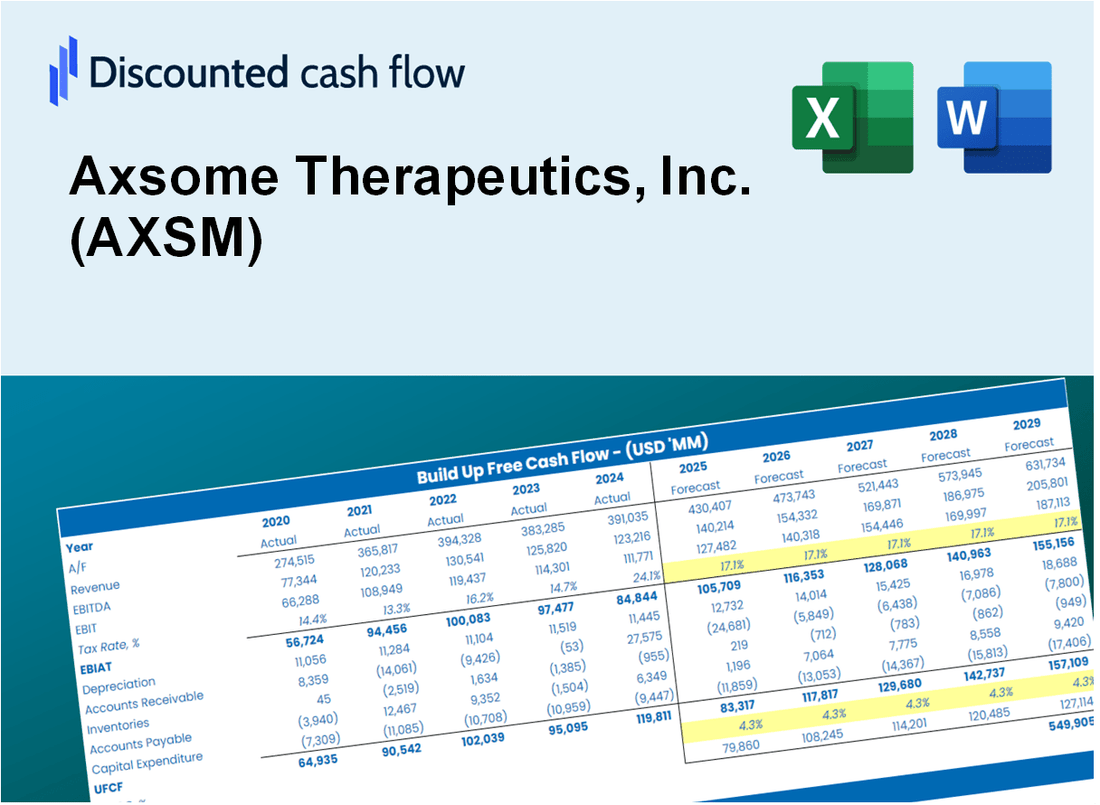
Vous cherchez à évaluer la valeur intrinsèque d'Axsome Therapeutics, Inc.? Notre calculatrice AXSM DCF intègre des données réelles avec des fonctionnalités de personnalisation complètes, vous permettant d'affiner vos prévisions et d'améliorer vos stratégies d'investissement.
What You Will Receive
- Comprehensive Financial Model: Axsome Therapeutics’ actual data allows for accurate DCF valuation.
- Full Forecasting Flexibility: Modify revenue growth, profit margins, WACC, and other essential metrics.
- Real-Time Calculations: Automatic updates provide immediate results as you make adjustments.
- Professional-Grade Template: A polished Excel file crafted for top-tier valuation.
- Customizable and Versatile: Designed for adaptability, enabling repeated use for in-depth forecasts.
Key Features
- Customizable Financial Metrics: Adjust essential factors such as revenue projections, R&D spending, and operational costs.
- Instant DCF Valuation: Automatically computes intrinsic value, NPV, and additional financial metrics in real-time.
- High-Precision Accuracy: Leverages Axsome Therapeutics' actual financial data for credible valuation results.
- Effortless Scenario Analysis: Evaluate various assumptions and analyze results with ease.
- Efficiency Booster: Avoid the hassle of constructing intricate valuation models from the ground up.
How It Works
- Step 1: Download the Excel file.
- Step 2: Review pre-entered Axsome Therapeutics data (historical and projected).
- Step 3: Adjust key assumptions (yellow cells) based on your analysis.
- Step 4: View automatic recalculations for Axsome Therapeutics’ intrinsic value.
- Step 5: Use the outputs for investment decisions or reporting.
Why Choose Axsome Therapeutics Calculator?
- Accuracy: Utilizes real Axsome Therapeutics financial data for precise calculations.
- Flexibility: Tailored for users to easily adjust and test various inputs.
- Time-Saving: Eliminate the need to create a DCF model from the ground up.
- Professional-Grade: Crafted with the expertise and usability expected at the CFO level.
- User-Friendly: Intuitive interface suitable for users with any level of financial modeling experience.
Who Should Use Axsome Therapeutics, Inc. (AXSM)?
- Investors: Gain insights into innovative therapies and make informed investment decisions.
- Healthcare Analysts: Utilize comprehensive research and data to evaluate the company's pipeline and market potential.
- Pharmaceutical Consultants: Tailor reports and presentations on Axsome’s developments for clients in the biopharmaceutical sector.
- Medicine Enthusiasts: Explore advancements in treatment options and their implications for patient care.
- Educators and Students: Incorporate real-world case studies of Axsome Therapeutics into healthcare and business curricula.
What the Template Contains
- Operating and Balance Sheet Data: Pre-filled Axsome Therapeutics historical data and forecasts, including revenue, EBITDA, EBIT, and capital expenditures.
- WACC Calculation: A dedicated sheet for Weighted Average Cost of Capital (WACC), including parameters like Beta, risk-free rate, and share price.
- DCF Valuation (Unlevered and Levered): Editable Discounted Cash Flow models showing intrinsic value with detailed calculations.
- Financial Statements: Pre-loaded financial statements (annual and quarterly) to support analysis.
- Key Ratios: Includes profitability, leverage, and efficiency ratios for Axsome Therapeutics, Inc. (AXSM).
- Dashboard and Charts: Visual summary of valuation outputs and assumptions to analyze results easily.
Disclaimer
All information, articles, and product details provided on this website are for general informational and educational purposes only. We do not claim any ownership over, nor do we intend to infringe upon, any trademarks, copyrights, logos, brand names, or other intellectual property mentioned or depicted on this site. Such intellectual property remains the property of its respective owners, and any references here are made solely for identification or informational purposes, without implying any affiliation, endorsement, or partnership.
We make no representations or warranties, express or implied, regarding the accuracy, completeness, or suitability of any content or products presented. Nothing on this website should be construed as legal, tax, investment, financial, medical, or other professional advice. In addition, no part of this site—including articles or product references—constitutes a solicitation, recommendation, endorsement, advertisement, or offer to buy or sell any securities, franchises, or other financial instruments, particularly in jurisdictions where such activity would be unlawful.
All content is of a general nature and may not address the specific circumstances of any individual or entity. It is not a substitute for professional advice or services. Any actions you take based on the information provided here are strictly at your own risk. You accept full responsibility for any decisions or outcomes arising from your use of this website and agree to release us from any liability in connection with your use of, or reliance upon, the content or products found herein.