
|
Koninklijke Bam Groep NV (Bamnb.as) Valation DCF |
Entièrement Modifiable: Adapté À Vos Besoins Dans Excel Ou Sheets
Conception Professionnelle: Modèles Fiables Et Conformes Aux Normes Du Secteur
Pré-Construits Pour Une Utilisation Rapide Et Efficace
Compatible MAC/PC, entièrement débloqué
Aucune Expertise N'Est Requise; Facile À Suivre
Koninklijke BAM Groep nv (BAMNB.AS) Bundle
Évaluez les perspectives financières de Koninklijke Bam Groep NV comme un expert! Cette calculatrice (BAMNBAS) DCF vous fournit des données financières pré-remplies et la flexibilité complète pour modifier la croissance des revenus, le WACC, les marges et d'autres hypothèses critiques pour s'aligner sur vos prévisions.
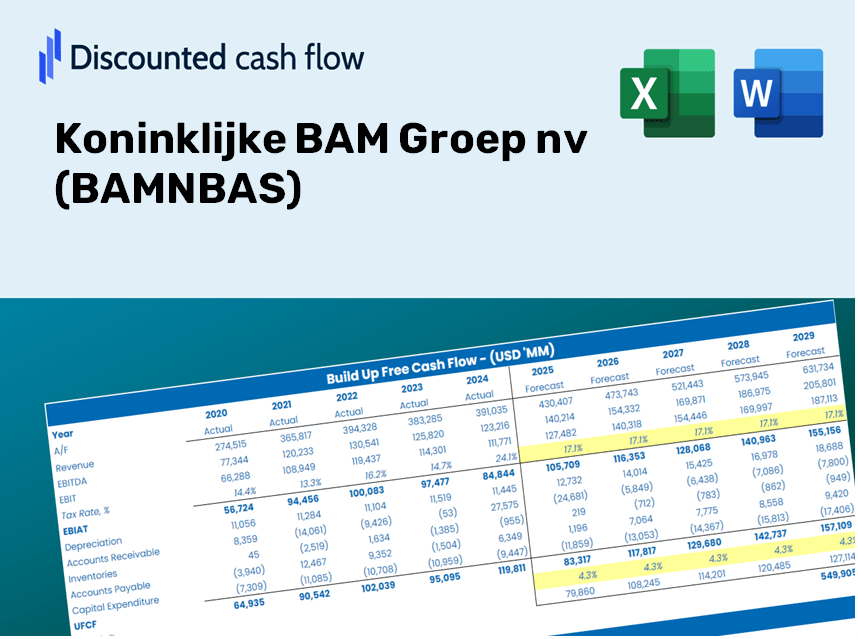
Discounted Cash Flow (DCF) - (USD MM)
| Year | AY1 2020 |
AY2 2021 |
AY3 2022 |
AY4 2023 |
AY5 2024 |
FY1 2025 |
FY2 2026 |
FY3 2027 |
FY4 2028 |
FY5 2029 |
|---|---|---|---|---|---|---|---|---|---|---|
| Revenue | 6,768.2 | 7,315.3 | 6,618.2 | 6,270.5 | 6,455.0 | 6,394.4 | 6,334.3 | 6,274.8 | 6,215.9 | 6,157.5 |
| Revenue Growth, % | 0 | 8.08 | -9.53 | -5.25 | 2.94 | -0.93921 | -0.93921 | -0.93921 | -0.93921 | -0.93921 |
| EBITDA | -48.3 | 177.2 | 280.4 | 285.4 | 214.4 | 176.7 | 175.1 | 173.4 | 171.8 | 170.2 |
| EBITDA, % | -0.71293 | 2.42 | 4.24 | 4.55 | 3.32 | 2.76 | 2.76 | 2.76 | 2.76 | 2.76 |
| Depreciation | 159.0 | 145.4 | 116.6 | 121.3 | 132.2 | 128.9 | 127.7 | 126.5 | 125.3 | 124.1 |
| Depreciation, % | 2.35 | 1.99 | 1.76 | 1.93 | 2.05 | 2.02 | 2.02 | 2.02 | 2.02 | 2.02 |
| EBIT | -207.3 | 31.8 | 163.8 | 164.1 | 82.2 | 47.8 | 47.3 | 46.9 | 46.5 | 46.0 |
| EBIT, % | -3.06 | 0.43469 | 2.47 | 2.62 | 1.27 | 0.74748 | 0.74748 | 0.74748 | 0.74748 | 0.74748 |
| Total Cash | 1,789.9 | 1,284.7 | 842.8 | 757.3 | 763.4 | 1,031.4 | 1,021.7 | 1,012.1 | 1,002.6 | 993.2 |
| Total Cash, percent | .0 | .0 | .0 | .0 | .0 | .0 | .0 | .0 | .0 | .0 |
| Account Receivables | 1,425.1 | 1,129.3 | 1,116.8 | 1,210.1 | 1,260.9 | 1,179.1 | 1,168.1 | 1,157.1 | 1,146.2 | 1,135.5 |
| Account Receivables, % | 21.06 | 15.44 | 16.88 | 19.3 | 19.53 | 18.44 | 18.44 | 18.44 | 18.44 | 18.44 |
| Inventories | 517.6 | 430.1 | 482.0 | 463.1 | 464.6 | 452.6 | 448.4 | 444.2 | 440.0 | 435.9 |
| Inventories, % | 7.65 | 5.88 | 7.28 | 7.39 | 7.2 | 7.08 | 7.08 | 7.08 | 7.08 | 7.08 |
| Accounts Payable | 898.6 | 2,871.7 | 499.7 | 507.3 | 2,433.5 | 1,354.0 | 1,341.3 | 1,328.7 | 1,316.2 | 1,303.8 |
| Accounts Payable, % | 13.28 | 39.26 | 7.55 | 8.09 | 37.7 | 21.17 | 21.17 | 21.17 | 21.17 | 21.17 |
| Capital Expenditure | -60.8 | -69.5 | -94.5 | -84.3 | -85.3 | -76.0 | -75.3 | -74.6 | -73.9 | -73.2 |
| Capital Expenditure, % | -0.89782 | -0.94952 | -1.43 | -1.34 | -1.32 | -1.19 | -1.19 | -1.19 | -1.19 | -1.19 |
| Tax Rate, % | -22.14 | -22.14 | -22.14 | -22.14 | -22.14 | -22.14 | -22.14 | -22.14 | -22.14 | -22.14 |
| EBITAT | -106.9 | 8.8 | 136.4 | 156.4 | 100.4 | 34.2 | 33.9 | 33.6 | 33.2 | 32.9 |
| Depreciation | ||||||||||
| Changes in Account Receivables | ||||||||||
| Changes in Inventories | ||||||||||
| Changes in Accounts Payable | ||||||||||
| Capital Expenditure | ||||||||||
| UFCF | -1,052.7 | 2,441.1 | -2,252.9 | 126.7 | 2,021.2 | -898.6 | 88.9 | 88.1 | 87.3 | 86.4 |
| WACC, % | 8.97 | 8.83 | 9.16 | 9.23 | 9.26 | 9.09 | 9.09 | 9.09 | 9.09 | 9.09 |
| PV UFCF | ||||||||||
| SUM PV UFCF | -563.6 | |||||||||
| Long Term Growth Rate, % | 0.50 | |||||||||
| Free cash flow (T + 1) | 87 | |||||||||
| Terminal Value | 1,011 | |||||||||
| Present Terminal Value | 655 | |||||||||
| Enterprise Value | 91 | |||||||||
| Net Debt | -440 | |||||||||
| Equity Value | 531 | |||||||||
| Diluted Shares Outstanding, MM | 271 | |||||||||
| Equity Value Per Share | 1.96 |
What You Will Receive
- Pre-Configured Financial Model: Utilize Koninklijke BAM Groep nv's (BAMNBAS) actual data for accurate DCF valuation.
- Comprehensive Forecast Control: Modify key drivers like revenue growth, margins, and WACC with ease.
- Real-Time Calculations: Automatic updates let you view results instantly as modifications are made.
- Professional-Grade Template: An expertly crafted Excel file tailored for high-quality valuation.
- Adaptable and Reusable: Designed for flexibility, allowing you to create detailed forecasts repeatedly.
Key Features
- Comprehensive DCF Calculator: Features thorough unlevered and levered DCF valuation models tailored for Koninklijke BAM Groep nv (BAMNBAS).
- WACC Calculator: Comes with a pre-defined Weighted Average Cost of Capital sheet allowing for customizable parameters.
- Customizable Forecast Assumptions: Adjust growth rates, capital expenditures, and discount rates as needed.
- Integrated Financial Ratios: Evaluate profitability, leverage, and efficiency metrics specific to Koninklijke BAM Groep nv (BAMNBAS).
- Visual Dashboard and Charts: Provides graphical outputs that highlight essential valuation metrics for straightforward analysis.
How It Works
- Step 1: Download the prebuilt Excel template featuring Koninklijke BAM Groep nv's (BAMNBAS) data.
- Step 2: Explore the pre-filled sheets to familiarize yourself with the essential metrics.
- Step 3: Update forecasts and assumptions in the editable yellow cells (WACC, growth, margins).
- Step 4: Instantly view recalculated results, including Koninklijke BAM Groep nv's (BAMNBAS) intrinsic value.
- Step 5: Make informed investment decisions or create reports based on the outputs.
Why Opt for BAM's Financial Calculator?
- Streamline Your Process: Skip the hassle of building a DCF model from the ground up – it's ready for immediate use.
- Enhance Precision: Access dependable financial data and formulas that minimize valuation inaccuracies.
- Completely Adaptable: Modify the model to align with your specific assumptions and forecasts.
- Simple to Analyze: Intuitive charts and outputs ensure results are easy to interpret.
- Endorsed by Professionals: Crafted for experts who prioritize accuracy and functionality.
Who Can Benefit from This Product?
- Construction Management Students: Master project valuation methods and apply them to real-world scenarios.
- Researchers: Integrate industry-specific models into your academic projects or studies.
- Investors: Validate your strategies and evaluate the financial metrics of Koninklijke BAM Groep nv (BAMNBAS).
- Financial Analysts: Enhance your analysis process with a tailored, easy-to-use DCF model.
- Entrepreneurs: Understand the valuation techniques used for large construction firms like Koninklijke BAM Groep nv (BAMNBAS).
Contents of the Template
- Pre-Filled DCF Model: BAM’s financial data preloaded for instant application.
- WACC Calculator: Comprehensive calculations for Weighted Average Cost of Capital.
- Financial Ratios: Assess BAM’s profitability, leverage, and efficiency metrics.
- Editable Inputs: Adjust assumptions such as growth rates, profit margins, and CAPEX to align with your scenarios.
- Financial Statements: Access annual and quarterly reports for in-depth analysis.
- Interactive Dashboard: Effortlessly visualize essential valuation metrics and outcomes.
Disclaimer
All information, articles, and product details provided on this website are for general informational and educational purposes only. We do not claim any ownership over, nor do we intend to infringe upon, any trademarks, copyrights, logos, brand names, or other intellectual property mentioned or depicted on this site. Such intellectual property remains the property of its respective owners, and any references here are made solely for identification or informational purposes, without implying any affiliation, endorsement, or partnership.
We make no representations or warranties, express or implied, regarding the accuracy, completeness, or suitability of any content or products presented. Nothing on this website should be construed as legal, tax, investment, financial, medical, or other professional advice. In addition, no part of this site—including articles or product references—constitutes a solicitation, recommendation, endorsement, advertisement, or offer to buy or sell any securities, franchises, or other financial instruments, particularly in jurisdictions where such activity would be unlawful.
All content is of a general nature and may not address the specific circumstances of any individual or entity. It is not a substitute for professional advice or services. Any actions you take based on the information provided here are strictly at your own risk. You accept full responsibility for any decisions or outcomes arising from your use of this website and agree to release us from any liability in connection with your use of, or reliance upon, the content or products found herein.