
|
Berger Paints India Limited (Bergepaint.NS) Évaluation DCF |
Entièrement Modifiable: Adapté À Vos Besoins Dans Excel Ou Sheets
Conception Professionnelle: Modèles Fiables Et Conformes Aux Normes Du Secteur
Pré-Construits Pour Une Utilisation Rapide Et Efficace
Compatible MAC/PC, entièrement débloqué
Aucune Expertise N'Est Requise; Facile À Suivre
Berger Paints India Limited (BERGEPAINT.NS) Bundle
Évaluez les perspectives financières de Berger Paints India Limited comme un expert! Cette calculatrice DCF (Bergepaintns) vous fournit des données financières pré-remplies et la flexibilité de modification de la croissance des revenus, du WACC, des marges et d'autres hypothèses essentielles pour s'aligner sur vos prévisions.
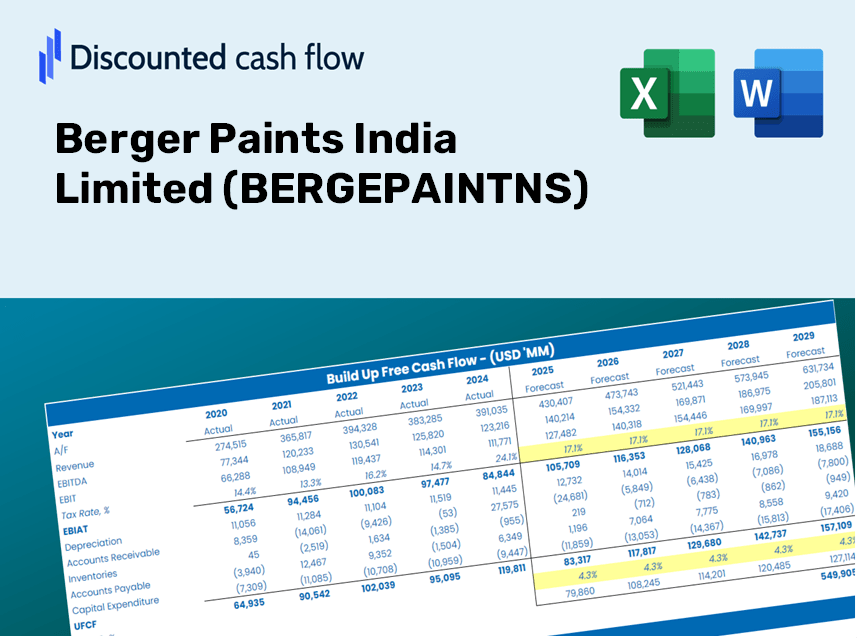
Discounted Cash Flow (DCF) - (USD MM)
| Year | AY1 2021 |
AY2 2022 |
AY3 2023 |
AY4 2024 |
AY5 2025 |
FY1 2026 |
FY2 2027 |
FY3 2028 |
FY4 2029 |
FY5 2030 |
|---|---|---|---|---|---|---|---|---|---|---|
| Revenue | 68,178.1 | 87,618.9 | 105,679.6 | 111,990.0 | 115,447.1 | 132,240.5 | 151,476.8 | 173,511.3 | 198,751.0 | 227,662.2 |
| Revenue Growth, % | 0 | 28.51 | 20.61 | 5.97 | 3.09 | 14.55 | 14.55 | 14.55 | 14.55 | 14.55 |
| EBITDA | 11,577.1 | 12,855.4 | 14,371.6 | 15,512.8 | 15,229.4 | 19,120.8 | 21,902.2 | 25,088.2 | 28,737.6 | 32,917.9 |
| EBITDA, % | 16.98 | 14.67 | 13.6 | 13.85 | 13.19 | 14.46 | 14.46 | 14.46 | 14.46 | 14.46 |
| Depreciation | 1,553.0 | 1,587.5 | 1,789.0 | 58.7 | 69.6 | 1,559.2 | 1,786.0 | 2,045.8 | 2,343.4 | 2,684.2 |
| Depreciation, % | 2.28 | 1.81 | 1.69 | 0.05241539 | 0.06028735 | 1.18 | 1.18 | 1.18 | 1.18 | 1.18 |
| EBIT | 10,024.1 | 11,267.9 | 12,582.6 | 15,454.1 | 15,159.8 | 17,561.6 | 20,116.2 | 23,042.4 | 26,394.2 | 30,233.6 |
| EBIT, % | 14.7 | 12.86 | 11.91 | 13.8 | 13.13 | 13.28 | 13.28 | 13.28 | 13.28 | 13.28 |
| Total Cash | 6,432.0 | 3,951.2 | 2,929.1 | 5,560.3 | 8,341.6 | 7,645.0 | 8,757.1 | 10,031.0 | 11,490.1 | 13,161.5 |
| Total Cash, percent | .0 | .0 | .0 | .0 | .0 | .0 | .0 | .0 | .0 | .0 |
| Account Receivables | 10,936.5 | 11,136.9 | 12,917.4 | 13,920.9 | 15,634.3 | 17,706.4 | 20,282.1 | 23,232.4 | 26,611.9 | 30,482.9 |
| Account Receivables, % | 16.04 | 12.71 | 12.22 | 12.43 | 13.54 | 13.39 | 13.39 | 13.39 | 13.39 | 13.39 |
| Inventories | 16,161.3 | 23,158.3 | 23,191.2 | 21,796.8 | 23,661.4 | 29,632.1 | 33,942.5 | 38,880.0 | 44,535.6 | 51,013.9 |
| Inventories, % | 23.7 | 26.43 | 21.94 | 19.46 | 20.5 | 22.41 | 22.41 | 22.41 | 22.41 | 22.41 |
| Accounts Payable | 14,233.4 | 18,028.9 | 17,656.9 | 16,792.1 | 17,402.7 | 23,335.1 | 26,729.5 | 30,617.7 | 35,071.5 | 40,173.1 |
| Accounts Payable, % | 20.88 | 20.58 | 16.71 | 14.99 | 15.07 | 17.65 | 17.65 | 17.65 | 17.65 | 17.65 |
| Capital Expenditure | -1,860.9 | -7,740.2 | -7,480.4 | -2,749.9 | -4,294.4 | -6,563.6 | -7,518.4 | -8,612.1 | -9,864.8 | -11,299.8 |
| Capital Expenditure, % | -2.73 | -8.83 | -7.08 | -2.46 | -3.72 | -4.96 | -4.96 | -4.96 | -4.96 | -4.96 |
| Tax Rate, % | 24.74 | 24.74 | 24.74 | 24.74 | 24.74 | 24.74 | 24.74 | 24.74 | 24.74 | 24.74 |
| EBITAT | 7,372.5 | 8,361.6 | 9,303.4 | 11,591.3 | 11,409.0 | 13,064.3 | 14,964.7 | 17,141.5 | 19,635.0 | 22,491.2 |
| Depreciation | ||||||||||
| Changes in Account Receivables | ||||||||||
| Changes in Inventories | ||||||||||
| Changes in Accounts Payable | ||||||||||
| Capital Expenditure | ||||||||||
| UFCF | -5,799.8 | -1,193.0 | 1,426.6 | 8,426.2 | 4,216.8 | 5,949.4 | 5,740.6 | 6,575.7 | 7,532.2 | 8,627.8 |
| WACC, % | 5.87 | 5.87 | 5.87 | 5.88 | 5.88 | 5.87 | 5.87 | 5.87 | 5.87 | 5.87 |
| PV UFCF | ||||||||||
| SUM PV UFCF | 28,760.8 | |||||||||
| Long Term Growth Rate, % | 4.00 | |||||||||
| Free cash flow (T + 1) | 8,973 | |||||||||
| Terminal Value | 478,558 | |||||||||
| Present Terminal Value | 359,722 | |||||||||
| Enterprise Value | 388,483 | |||||||||
| Net Debt | 1,698 | |||||||||
| Equity Value | 386,785 | |||||||||
| Diluted Shares Outstanding, MM | 1,166 | |||||||||
| Equity Value Per Share | 331.70 |
What You Will Receive
- Adjustable Forecast Inputs: Effortlessly modify key assumptions (growth %, margins, WACC) to explore various scenarios.
- Real-Time Data: Berger Paints India's financial metrics pre-loaded to kickstart your evaluation.
- Automated DCF Calculations: The template computes Net Present Value (NPV) and intrinsic value automatically.
- Customizable and Professional Design: A sleek Excel model tailored to fit your valuation requirements.
- Engineered for Analysts and Investors: Perfect for assessing projections, validating strategies, and enhancing efficiency.
Key Features
- Pre-Loaded Data: Berger Paints India Limited’s historical financial statements and pre-filled forecasts.
- Fully Adjustable Inputs: Customize WACC, tax rates, revenue growth, and EBITDA margins.
- Instant Results: View Berger Paints' intrinsic value recalculating in real time.
- Clear Visual Outputs: Dashboard charts highlight valuation results and key metrics.
- Built for Accuracy: A professional tool designed for analysts, investors, and finance professionals.
How It Works
- Download the Template: Gain immediate access to the Excel-based BERGEPAINTNS DCF Calculator.
- Input Your Assumptions: Modify the yellow-highlighted cells for growth rates, WACC, margins, and other parameters.
- Instant Calculations: The model automatically recalculates the intrinsic value of Berger Paints India Limited.
- Test Scenarios: Experiment with various assumptions to assess potential changes in valuation.
- Analyze and Decide: Utilize the outcomes to inform your investment or financial evaluation.
Why Opt for Berger Paints India Limited (BERGEPAINTNS)?
- Time Efficient: Skip the hassle of extensive research – our products are ready for immediate use.
- Enhanced Precision: High-quality materials and formulations minimize the chances of error in application.
- Completely Adaptable: Customize your choices to match your unique style and project requirements.
- User-Friendly: Intuitive packaging and instructions simplify the painting process for everyone.
- Endorsed by Professionals: Trusted by industry experts who prioritize quality and performance.
Who Should Consider Using This Product?
- Professional Investors: Develop comprehensive and trustworthy valuation models for analyzing their portfolios.
- Corporate Finance Teams: Evaluate valuation scenarios to inform and shape internal strategies.
- Consultants and Advisors: Offer clients precise valuation insights specifically for Berger Paints India Limited (BERGEPAINTNS).
- Students and Educators: Leverage real-world data for practicing and teaching financial modeling techniques.
- Home Improvement Enthusiasts: Gain insights into how companies like Berger Paints India Limited (BERGEPAINTNS) are valued within the market.
What the Template Includes
- Preloaded BERGEPAINTNS Data: Historical and forecasted financial data, encompassing revenue, EBIT, and capital expenditures.
- DCF and WACC Models: Advanced spreadsheets for determining intrinsic value and Weighted Average Cost of Capital.
- Editable Inputs: Cells highlighted in yellow for customizing revenue growth, tax rates, and discount rates.
- Financial Statements: Detailed annual and quarterly financial statements for in-depth analysis.
- Key Ratios: Metrics for profitability, leverage, and efficiency to assess overall performance.
- Dashboard and Charts: Visual representations of valuation results and underlying assumptions.
Disclaimer
All information, articles, and product details provided on this website are for general informational and educational purposes only. We do not claim any ownership over, nor do we intend to infringe upon, any trademarks, copyrights, logos, brand names, or other intellectual property mentioned or depicted on this site. Such intellectual property remains the property of its respective owners, and any references here are made solely for identification or informational purposes, without implying any affiliation, endorsement, or partnership.
We make no representations or warranties, express or implied, regarding the accuracy, completeness, or suitability of any content or products presented. Nothing on this website should be construed as legal, tax, investment, financial, medical, or other professional advice. In addition, no part of this site—including articles or product references—constitutes a solicitation, recommendation, endorsement, advertisement, or offer to buy or sell any securities, franchises, or other financial instruments, particularly in jurisdictions where such activity would be unlawful.
All content is of a general nature and may not address the specific circumstances of any individual or entity. It is not a substitute for professional advice or services. Any actions you take based on the information provided here are strictly at your own risk. You accept full responsibility for any decisions or outcomes arising from your use of this website and agree to release us from any liability in connection with your use of, or reliance upon, the content or products found herein.