
|
Bharti Airtel Limited (Bhartiartl.NS) Évaluation DCF |
Entièrement Modifiable: Adapté À Vos Besoins Dans Excel Ou Sheets
Conception Professionnelle: Modèles Fiables Et Conformes Aux Normes Du Secteur
Pré-Construits Pour Une Utilisation Rapide Et Efficace
Compatible MAC/PC, entièrement débloqué
Aucune Expertise N'Est Requise; Facile À Suivre
Bharti Airtel Limited (BHARTIARTL.NS) Bundle
Évaluez les perspectives financières de Bharti Airtel Limited comme un expert! Ce calculatrice DCF (Bhartiartlns) fournit des informations financières pré-remplies ainsi que la flexibilité de modification de la croissance des revenus, du WACC, des marges et d'autres hypothèses cruciales pour s'aligner sur vos projections.
Discounted Cash Flow (DCF) - (USD MM)
| Year | AY1 2021 |
AY2 2022 |
AY3 2023 |
AY4 2024 |
AY5 2025 |
FY1 2026 |
FY2 2027 |
FY3 2028 |
FY4 2029 |
FY5 2030 |
|---|---|---|---|---|---|---|---|---|---|---|
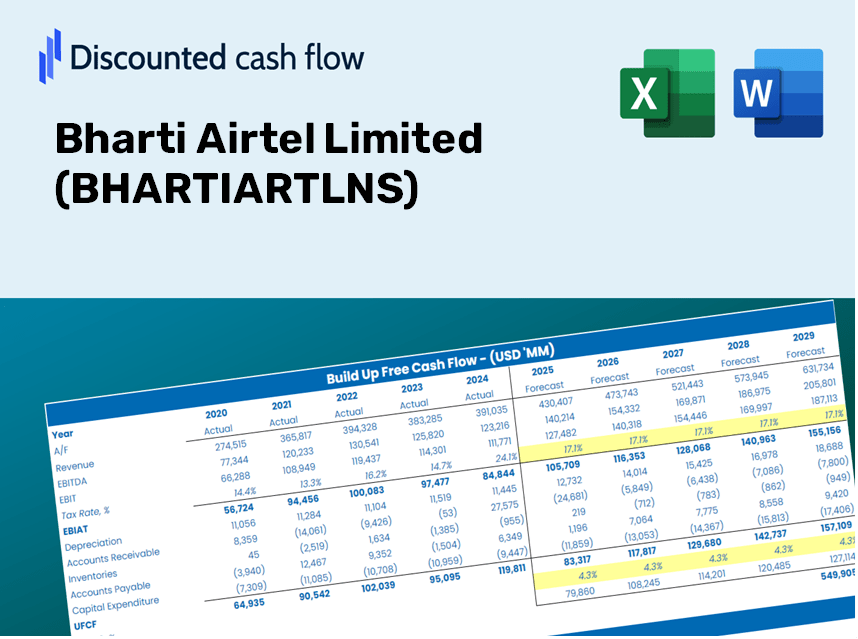
| Revenue | 1,006,158.0 | 1,165,469.0 | 1,391,448.0 | 1,499,824.0 | 1,729,852.0 | 1,982,189.2 | 2,271,335.3 | 2,602,659.9 | 2,982,315.4 | 3,417,352.1 |
| Revenue Growth, % | 0 | 15.83 | 19.39 | 7.79 | 15.34 | 14.59 | 14.59 | 14.59 | 14.59 | 14.59 |
| EBITDA | 297,807.0 | 589,508.0 | 690,915.0 | 684,653.0 | 1,013,283.0 | 927,899.1 | 1,063,253.8 | 1,218,352.8 | 1,396,076.6 | 1,599,725.2 |
| EBITDA, % | 29.6 | 50.58 | 49.65 | 45.65 | 58.58 | 46.81 | 46.81 | 46.81 | 46.81 | 46.81 |
| Depreciation | 294,044.0 | 330,907.0 | 364,318.0 | 395,376.0 | 455,703.0 | 541,156.1 | 620,095.7 | 710,550.4 | 814,199.9 | 932,968.9 |
| Depreciation, % | 29.22 | 28.39 | 26.18 | 26.36 | 26.34 | 27.3 | 27.3 | 27.3 | 27.3 | 27.3 |
| EBIT | 3,763.0 | 258,601.0 | 326,597.0 | 289,277.0 | 557,580.0 | 386,743.0 | 443,158.1 | 507,802.5 | 581,876.7 | 666,756.3 |
| EBIT, % | 0.374 | 22.19 | 23.47 | 19.29 | 32.23 | 19.51 | 19.51 | 19.51 | 19.51 | 19.51 |
| Total Cash | 317,428.0 | 282,782.0 | 402,096.0 | 109,847.0 | 183,731.0 | 406,962.3 | 466,326.7 | 534,350.8 | 612,297.7 | 701,614.8 |
| Total Cash, percent | .0 | .0 | .0 | .0 | .0 | .0 | .0 | .0 | .0 | .0 |
| Account Receivables | 163,826.0 | 59,613.0 | 63,342.0 | 73,984.0 | 74,557.0 | 139,515.9 | 159,867.4 | 183,187.6 | 209,909.5 | 240,529.5 |
| Account Receivables, % | 16.28 | 5.11 | 4.55 | 4.93 | 4.31 | 7.04 | 7.04 | 7.04 | 7.04 | 7.04 |
| Inventories | 2,660.0 | 3,750.0 | 2,576.0 | 3,639.0 | .0 | 4,019.4 | 4,605.8 | 5,277.6 | 6,047.5 | 6,929.6 |
| Inventories, % | 0.26437 | 0.32176 | 0.18513 | 0.24263 | 0 | 0.20278 | 0.20278 | 0.20278 | 0.20278 | 0.20278 |
| Accounts Payable | 278,721.0 | 292,741.0 | 328,946.0 | 351,325.0 | 381,537.0 | 483,417.9 | 553,935.1 | 634,738.8 | 727,329.5 | 833,426.6 |
| Accounts Payable, % | 27.7 | 25.12 | 23.64 | 23.42 | 22.06 | 24.39 | 24.39 | 24.39 | 24.39 | 24.39 |
| Capital Expenditure | -248,143.0 | -265,406.0 | -260,566.0 | -381,915.0 | -379,077.0 | -450,111.4 | -515,770.1 | -591,006.6 | -677,218.0 | -776,005.3 |
| Capital Expenditure, % | -24.66 | -22.77 | -18.73 | -25.46 | -21.91 | -22.71 | -22.71 | -22.71 | -22.71 | -22.71 |
| Tax Rate, % | 12.61 | 12.61 | 12.61 | 12.61 | 12.61 | 12.61 | 12.61 | 12.61 | 12.61 | 12.61 |
| EBITAT | 6,371.9 | 88,144.9 | 164,591.2 | 170,362.9 | 487,264.1 | 255,840.5 | 293,160.5 | 335,924.4 | 384,926.4 | 441,076.4 |
| Depreciation | ||||||||||
| Changes in Account Receivables | ||||||||||
| Changes in Inventories | ||||||||||
| Changes in Accounts Payable | ||||||||||
| Capital Expenditure | ||||||||||
| UFCF | 164,507.9 | 270,788.9 | 301,993.2 | 194,497.9 | 597,168.1 | 379,787.7 | 447,065.4 | 512,279.8 | 587,007.1 | 672,635.1 |
| WACC, % | 5.34 | 4.36 | 4.6 | 4.73 | 5.15 | 4.83 | 4.83 | 4.83 | 4.83 | 4.83 |
| PV UFCF | ||||||||||
| SUM PV UFCF | 2,230,945.3 | |||||||||
| Long Term Growth Rate, % | 4.00 | |||||||||
| Free cash flow (T + 1) | 699,540 | |||||||||
| Terminal Value | 83,937,082 | |||||||||
| Present Terminal Value | 66,291,110 | |||||||||
| Enterprise Value | 68,522,056 | |||||||||
| Net Debt | 1,969,222 | |||||||||
| Equity Value | 66,552,834 | |||||||||
| Diluted Shares Outstanding, MM | 5,988 | |||||||||
| Equity Value Per Share | 11,114.58 |
What You Will Receive
- Authentic Bharti Airtel Data: Comprehensive financials – encompassing revenue to EBIT – derived from actual and forecasted figures.
- Complete Customization: Modify all essential parameters (yellow cells) such as WACC, growth %, and tax rates.
- Real-Time Valuation Updates: Automatic recalculations to assess the effects of adjustments on Bharti Airtel’s fair value.
- Dynamic Excel Template: Designed for swift modifications, scenario analyses, and in-depth projections.
- Efficient and Precise: Avoid starting from scratch with models while ensuring accuracy and adaptability.
Key Features
- Comprehensive Bharti Airtel Financials: Gain access to reliable pre-loaded historical figures and future projections.
- Tailorable Forecast Assumptions: Modify the yellow-highlighted fields such as WACC, growth rates, and profit margins.
- Automatic Calculations: Enjoy real-time updates to DCF, Net Present Value (NPV), and cash flow assessments.
- User-Friendly Dashboard: Clear charts and summaries that help you visualize your valuation findings.
- Designed for All Users: An intuitive layout crafted for investors, CFOs, and consultants, regardless of expertise.
How It Works
- Step 1: Download the prebuilt Excel template featuring Bharti Airtel Limited’s data.
- Step 2: Navigate through the pre-filled sheets to familiarize yourself with the essential metrics.
- Step 3: Adjust forecasts and assumptions in the editable yellow cells (WACC, growth, margins).
- Step 4: Instantly see updated results, including the intrinsic value of Bharti Airtel Limited (BHARTIARTLNS).
- Step 5: Use the outcomes to make informed investment choices or create detailed reports.
Why Opt for This Calculator?
- User-Friendly Interface: Suitable for both novices and seasoned professionals.
- Customizable Inputs: Effortlessly adjust parameters to suit your financial analysis.
- Real-Time Updates: Instantly view changes to Bharti Airtel's valuation as you modify inputs.
- Pre-Loaded Data: Comes with Bharti Airtel’s actual financial information for quick assessments.
- Relied Upon by Experts: Trusted by investors and analysts for making well-informed choices.
Who Can Benefit from This Product?
- Finance Students: Master valuation methods and apply them to real-world data.
- Academics: Use professional valuation models in your curriculum or research projects.
- Investors: Evaluate your own assumptions and assess valuation results for Bharti Airtel Limited (BHARTIARTLNS).
- Analysts: Enhance your efficiency with a customizable DCF model that's ready to use.
- Small Business Owners: Discover how major public companies like Bharti Airtel Limited (BHARTIARTLNS) are evaluated in the market.
Components of the Template
- Pre-Filled Data: Contains Bharti Airtel's historical financial metrics and projections.
- Discounted Cash Flow Model: A customizable DCF valuation model featuring automatic calculations.
- Weighted Average Cost of Capital (WACC): A specific worksheet for WACC computation based on user-defined inputs.
- Key Financial Ratios: Evaluate Bharti Airtel’s profitability, efficiency, and leverage metrics.
- Customizable Inputs: Easily modify revenue growth, profit margins, and tax rates.
- Clear Dashboard: Visuals and tables highlighting essential valuation outcomes.
Disclaimer
All information, articles, and product details provided on this website are for general informational and educational purposes only. We do not claim any ownership over, nor do we intend to infringe upon, any trademarks, copyrights, logos, brand names, or other intellectual property mentioned or depicted on this site. Such intellectual property remains the property of its respective owners, and any references here are made solely for identification or informational purposes, without implying any affiliation, endorsement, or partnership.
We make no representations or warranties, express or implied, regarding the accuracy, completeness, or suitability of any content or products presented. Nothing on this website should be construed as legal, tax, investment, financial, medical, or other professional advice. In addition, no part of this site—including articles or product references—constitutes a solicitation, recommendation, endorsement, advertisement, or offer to buy or sell any securities, franchises, or other financial instruments, particularly in jurisdictions where such activity would be unlawful.
All content is of a general nature and may not address the specific circumstances of any individual or entity. It is not a substitute for professional advice or services. Any actions you take based on the information provided here are strictly at your own risk. You accept full responsibility for any decisions or outcomes arising from your use of this website and agree to release us from any liability in connection with your use of, or reliance upon, the content or products found herein.