
|
Black Hills Corporation (BKH) Évaluation DCF |
Entièrement Modifiable: Adapté À Vos Besoins Dans Excel Ou Sheets
Conception Professionnelle: Modèles Fiables Et Conformes Aux Normes Du Secteur
Pré-Construits Pour Une Utilisation Rapide Et Efficace
Compatible MAC/PC, entièrement débloqué
Aucune Expertise N'Est Requise; Facile À Suivre
Black Hills Corporation (BKH) Bundle
Explorez les perspectives financières de Black Hills Corporation (BKH) avec notre calculatrice DCF conviviale! Entrez vos hypothèses concernant la croissance, les marges et les coûts pour calculer la valeur intrinsèque de Black Hills Corporation (BKH) et affiner votre approche d'investissement.
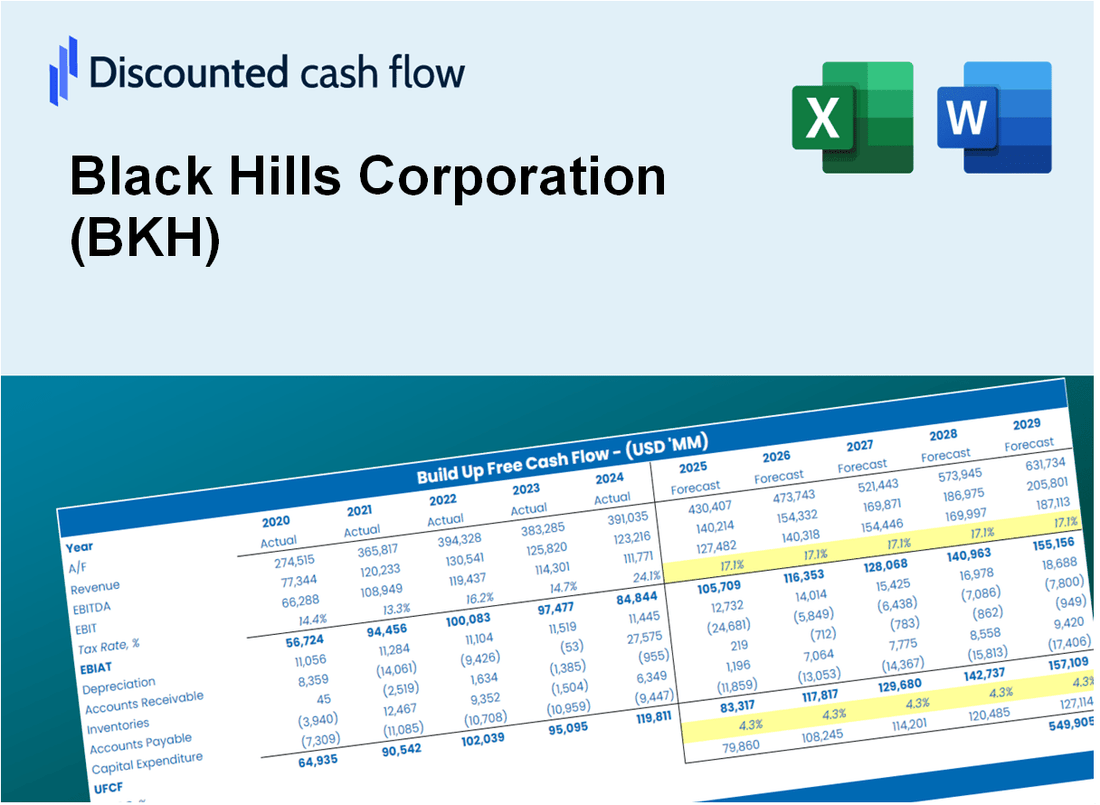
Discounted Cash Flow (DCF) - (USD MM)
| Year | AY1 2020 |
AY2 2021 |
AY3 2022 |
AY4 2023 |
AY5 2024 |
FY1 2025 |
FY2 2026 |
FY3 2027 |
FY4 2028 |
FY5 2029 |
|---|---|---|---|---|---|---|---|---|---|---|
| Revenue | 1,696.9 | 1,949.1 | 2,551.8 | 2,331.3 | 2,127.7 | 2,278.8 | 2,440.6 | 2,614.0 | 2,799.6 | 2,998.4 |
| Revenue Growth, % | 0 | 14.86 | 30.92 | -8.64 | -8.73 | 7.1 | 7.1 | 7.1 | 7.1 | 7.1 |
| EBITDA | 645.1 | 648.5 | 709.5 | 738.4 | 785.3 | 764.2 | 818.4 | 876.6 | 938.8 | 1,005.5 |
| EBITDA, % | 38.01 | 33.27 | 27.8 | 31.67 | 36.91 | 33.53 | 33.53 | 33.53 | 33.53 | 33.53 |
| Depreciation | 224.5 | 236.0 | 250.9 | 256.8 | 270.1 | 268.3 | 287.4 | 307.8 | 329.7 | 353.1 |
| Depreciation, % | 13.23 | 12.11 | 9.83 | 11.02 | 12.69 | 11.78 | 11.78 | 11.78 | 11.78 | 11.78 |
| EBIT | 420.6 | 412.5 | 458.6 | 481.6 | 515.2 | 495.8 | 531.1 | 568.8 | 609.2 | 652.4 |
| EBIT, % | 24.79 | 21.16 | 17.97 | 20.66 | 24.21 | 21.76 | 21.76 | 21.76 | 21.76 | 21.76 |
| Total Cash | 6.4 | 8.9 | 21.4 | 86.6 | 16.1 | 28.0 | 30.0 | 32.1 | 34.4 | 36.8 |
| Total Cash, percent | .0 | .0 | .0 | .0 | .0 | .0 | .0 | .0 | .0 | .0 |
| Account Receivables | 285.4 | 339.7 | 525.8 | 368.8 | 371.0 | 401.6 | 430.1 | 460.6 | 493.3 | 528.4 |
| Account Receivables, % | 16.82 | 17.43 | 20.61 | 15.82 | 17.44 | 17.62 | 17.62 | 17.62 | 17.62 | 17.62 |
| Inventories | 117.4 | 151.0 | 207.4 | 160.9 | 153.9 | 168.3 | 180.3 | 193.1 | 206.8 | 221.4 |
| Inventories, % | 6.92 | 7.75 | 8.13 | 6.9 | 7.23 | 7.39 | 7.39 | 7.39 | 7.39 | 7.39 |
| Accounts Payable | 183.3 | 217.8 | 310.0 | 186.4 | 229.1 | 241.0 | 258.2 | 276.5 | 296.1 | 317.2 |
| Accounts Payable, % | 10.8 | 11.17 | 12.15 | 8 | 10.77 | 10.58 | 10.58 | 10.58 | 10.58 | 10.58 |
| Capital Expenditure | -767.4 | -677.5 | -604.4 | -555.6 | -744.2 | -740.5 | -793.1 | -849.4 | -909.7 | -974.3 |
| Capital Expenditure, % | -45.22 | -34.76 | -23.68 | -23.83 | -34.98 | -32.49 | -32.49 | -32.49 | -32.49 | -32.49 |
| Tax Rate, % | 14.66 | 14.66 | 14.66 | 14.66 | 14.66 | 14.66 | 14.66 | 14.66 | 14.66 | 14.66 |
| EBITAT | 347.3 | 377.9 | 400.3 | 418.7 | 439.7 | 430.1 | 460.7 | 493.4 | 528.4 | 566.0 |
| Depreciation | ||||||||||
| Changes in Account Receivables | ||||||||||
| Changes in Inventories | ||||||||||
| Changes in Accounts Payable | ||||||||||
| Capital Expenditure | ||||||||||
| UFCF | -415.1 | -117.1 | -103.4 | 199.8 | 13.1 | -75.0 | -68.4 | -73.2 | -78.4 | -84.0 |
| WACC, % | 5.57 | 5.76 | 5.67 | 5.66 | 5.62 | 5.65 | 5.65 | 5.65 | 5.65 | 5.65 |
| PV UFCF | ||||||||||
| SUM PV UFCF | -321.1 | |||||||||
| Long Term Growth Rate, % | 2.00 | |||||||||
| Free cash flow (T + 1) | -86 | |||||||||
| Terminal Value | -2,344 | |||||||||
| Present Terminal Value | -1,781 | |||||||||
| Enterprise Value | -2,102 | |||||||||
| Net Debt | 4,368 | |||||||||
| Equity Value | -6,470 | |||||||||
| Diluted Shares Outstanding, MM | 70 | |||||||||
| Equity Value Per Share | -92.55 |
What You Will Get
- Editable Forecast Inputs: Easily modify assumptions (growth %, margins, WACC) to generate various scenarios.
- Real-World Data: Black Hills Corporation’s (BKH) financial data pre-loaded to facilitate your analysis.
- Automatic DCF Outputs: The template computes Net Present Value (NPV) and intrinsic value for you.
- Customizable and Professional: A refined Excel model that adjusts to your valuation requirements.
- Built for Analysts and Investors: Perfect for evaluating projections, confirming strategies, and enhancing efficiency.
Key Features
- 🔍 Real-Life BKH Financials: Pre-filled historical and projected data for Black Hills Corporation (BKH).
- ✏️ Fully Customizable Inputs: Adjust all critical parameters (yellow cells) like WACC, growth %, and tax rates.
- 📊 Professional DCF Valuation: Built-in formulas calculate Black Hills Corporation’s intrinsic value using the Discounted Cash Flow method.
- ⚡ Instant Results: Visualize Black Hills Corporation’s valuation instantly after making changes.
- Scenario Analysis: Test and compare outcomes for various financial assumptions side-by-side.
How It Works
- Step 1: Download the prebuilt Excel template featuring Black Hills Corporation’s (BKH) data.
- Step 2: Navigate through the pre-filled sheets and familiarize yourself with the essential metrics.
- Step 3: Modify forecasts and assumptions in the editable yellow cells (WACC, growth, margins).
- Step 4: Instantly view the recalibrated results, including Black Hills Corporation’s (BKH) intrinsic value.
- Step 5: Make well-informed investment decisions or create reports based on the outputs.
Why Choose This Calculator for Black Hills Corporation (BKH)?
- Accurate Data: Utilizes real Black Hills Corporation financials for dependable valuation outcomes.
- Customizable: Tailor essential parameters such as growth rates, WACC, and tax rates to align with your forecasts.
- Time-Saving: Ready-made calculations streamline the process, so you don’t have to start from square one.
- Professional-Grade Tool: Crafted for investors, analysts, and consultants focused on Black Hills Corporation.
- User-Friendly: Easy-to-navigate design and clear instructions cater to users of all experience levels.
Who Should Use This Product?
- Investors: Accurately assess Black Hills Corporation's (BKH) fair value prior to making investment choices.
- CFOs: Utilize a professional-grade DCF model for financial reporting and analysis specific to Black Hills Corporation (BKH).
- Consultants: Easily modify the template for valuation reports tailored to clients interested in Black Hills Corporation (BKH).
- Entrepreneurs: Acquire knowledge about financial modeling practices employed by leading companies like Black Hills Corporation (BKH).
- Educators: Implement it as a teaching resource to illustrate valuation methodologies using Black Hills Corporation (BKH) as a case study.
What the Template Contains
- Operating and Balance Sheet Data: Pre-filled Black Hills Corporation (BKH) historical data and forecasts, including revenue, EBITDA, EBIT, and capital expenditures.
- WACC Calculation: A dedicated sheet for Weighted Average Cost of Capital (WACC), including parameters like Beta, risk-free rate, and share price.
- DCF Valuation (Unlevered and Levered): Editable Discounted Cash Flow models showing intrinsic value with detailed calculations.
- Financial Statements: Pre-loaded financial statements (annual and quarterly) to support analysis.
- Key Ratios: Includes profitability, leverage, and efficiency ratios for Black Hills Corporation (BKH).
- Dashboard and Charts: Visual summary of valuation outputs and assumptions to analyze results easily.
Disclaimer
All information, articles, and product details provided on this website are for general informational and educational purposes only. We do not claim any ownership over, nor do we intend to infringe upon, any trademarks, copyrights, logos, brand names, or other intellectual property mentioned or depicted on this site. Such intellectual property remains the property of its respective owners, and any references here are made solely for identification or informational purposes, without implying any affiliation, endorsement, or partnership.
We make no representations or warranties, express or implied, regarding the accuracy, completeness, or suitability of any content or products presented. Nothing on this website should be construed as legal, tax, investment, financial, medical, or other professional advice. In addition, no part of this site—including articles or product references—constitutes a solicitation, recommendation, endorsement, advertisement, or offer to buy or sell any securities, franchises, or other financial instruments, particularly in jurisdictions where such activity would be unlawful.
All content is of a general nature and may not address the specific circumstances of any individual or entity. It is not a substitute for professional advice or services. Any actions you take based on the information provided here are strictly at your own risk. You accept full responsibility for any decisions or outcomes arising from your use of this website and agree to release us from any liability in connection with your use of, or reliance upon, the content or products found herein.