
|
Byline Bancorp, Inc. (par) évaluation DCF |
Entièrement Modifiable: Adapté À Vos Besoins Dans Excel Ou Sheets
Conception Professionnelle: Modèles Fiables Et Conformes Aux Normes Du Secteur
Pré-Construits Pour Une Utilisation Rapide Et Efficace
Compatible MAC/PC, entièrement débloqué
Aucune Expertise N'Est Requise; Facile À Suivre
Byline Bancorp, Inc. (BY) Bundle
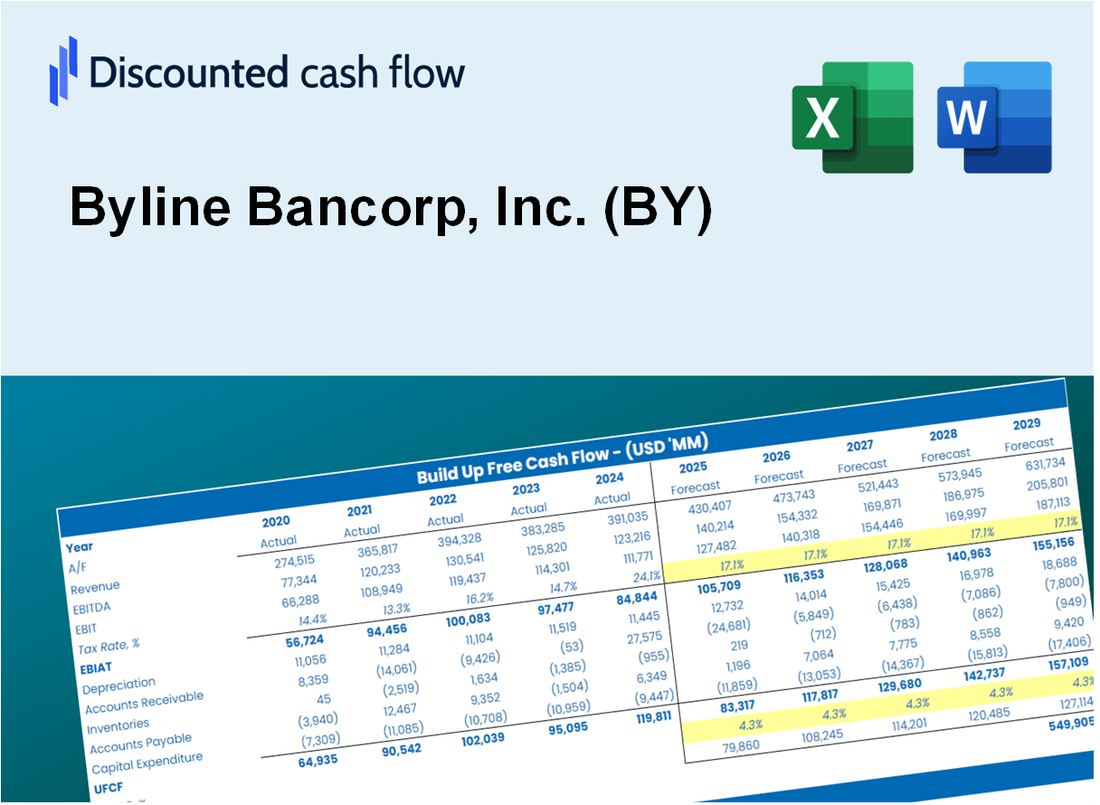
Que vous soyez un investisseur ou un analyste, ce (par) calculatrice DCF est votre ressource incontournable pour une évaluation précise. Chargé de données réelles de Byline Bancorp, Inc., vous pouvez ajuster les prévisions et observer les effets en temps réel.
What You Will Receive
- Pre-Filled Financial Model: Byline Bancorp, Inc.’s actual data allows for accurate DCF valuation.
- Comprehensive Forecast Control: Modify revenue growth, profit margins, WACC, and other essential factors.
- Real-Time Calculations: Automatic updates provide immediate feedback as you make adjustments.
- Investor-Ready Template: A polished Excel file crafted for high-quality valuation presentations.
- Customizable and Reusable: Designed for adaptability, facilitating repeated use for in-depth forecasts.
Key Features
- 🔍 Real-Life BY Financials: Pre-filled historical and projected data for Byline Bancorp, Inc. (BY).
- ✏️ Fully Customizable Inputs: Adjust all critical parameters (yellow cells) like WACC, growth %, and tax rates.
- 📊 Professional DCF Valuation: Built-in formulas calculate Byline Bancorp’s intrinsic value using the Discounted Cash Flow method.
- ⚡ Instant Results: Visualize Byline Bancorp’s valuation instantly after making changes.
- Scenario Analysis: Test and compare outcomes for various financial assumptions side-by-side.
How It Works
- Step 1: Download the Excel file.
- Step 2: Review pre-entered Byline Bancorp, Inc. (BY) data (historical and projected).
- Step 3: Adjust key assumptions (yellow cells) based on your analysis.
- Step 4: View automatic recalculations for Byline Bancorp, Inc. (BY)’s intrinsic value.
- Step 5: Use the outputs for investment decisions or reporting.
Why Choose This Calculator for Byline Bancorp, Inc. (BY)?
- Accurate Data: Access real Byline Bancorp financials for dependable valuation outcomes.
- Customizable: Tailor essential parameters such as growth rates, WACC, and tax rates to fit your forecasts.
- Time-Saving: Pre-configured calculations remove the hassle of starting from scratch.
- Professional-Grade Tool: Crafted for investors, analysts, and financial consultants.
- User-Friendly: Designed with an intuitive interface and clear instructions for all users.
Who Should Use This Product?
- Investors: Accurately estimate Byline Bancorp, Inc.’s (BY) fair value before making investment decisions.
- CFOs: Leverage a professional-grade DCF model for financial reporting and analysis of Byline Bancorp, Inc. (BY).
- Consultants: Quickly adapt the template for valuation reports tailored to Byline Bancorp, Inc. (BY) clients.
- Entrepreneurs: Gain insights into financial modeling practices used by leading banks, including Byline Bancorp, Inc. (BY).
- Educators: Use it as a teaching tool to demonstrate valuation methodologies relevant to Byline Bancorp, Inc. (BY).
What the Template Contains
- Historical Data: Includes Byline Bancorp, Inc.’s past financials and baseline forecasts.
- DCF and Levered DCF Models: Detailed templates to calculate Byline Bancorp, Inc.’s intrinsic value.
- WACC Sheet: Pre-built calculations for Weighted Average Cost of Capital.
- Editable Inputs: Modify key drivers like growth rates, EBITDA %, and CAPEX assumptions.
- Quarterly and Annual Statements: A complete breakdown of Byline Bancorp, Inc.’s financials.
- Interactive Dashboard: Visualize valuation results and projections dynamically.
Disclaimer
All information, articles, and product details provided on this website are for general informational and educational purposes only. We do not claim any ownership over, nor do we intend to infringe upon, any trademarks, copyrights, logos, brand names, or other intellectual property mentioned or depicted on this site. Such intellectual property remains the property of its respective owners, and any references here are made solely for identification or informational purposes, without implying any affiliation, endorsement, or partnership.
We make no representations or warranties, express or implied, regarding the accuracy, completeness, or suitability of any content or products presented. Nothing on this website should be construed as legal, tax, investment, financial, medical, or other professional advice. In addition, no part of this site—including articles or product references—constitutes a solicitation, recommendation, endorsement, advertisement, or offer to buy or sell any securities, franchises, or other financial instruments, particularly in jurisdictions where such activity would be unlawful.
All content is of a general nature and may not address the specific circumstances of any individual or entity. It is not a substitute for professional advice or services. Any actions you take based on the information provided here are strictly at your own risk. You accept full responsibility for any decisions or outcomes arising from your use of this website and agree to release us from any liability in connection with your use of, or reliance upon, the content or products found herein.