
|
Century Communities, Inc. (CCS) Évaluation DCF |
Entièrement Modifiable: Adapté À Vos Besoins Dans Excel Ou Sheets
Conception Professionnelle: Modèles Fiables Et Conformes Aux Normes Du Secteur
Pré-Construits Pour Une Utilisation Rapide Et Efficace
Compatible MAC/PC, entièrement débloqué
Aucune Expertise N'Est Requise; Facile À Suivre
Century Communities, Inc. (CCS) Bundle
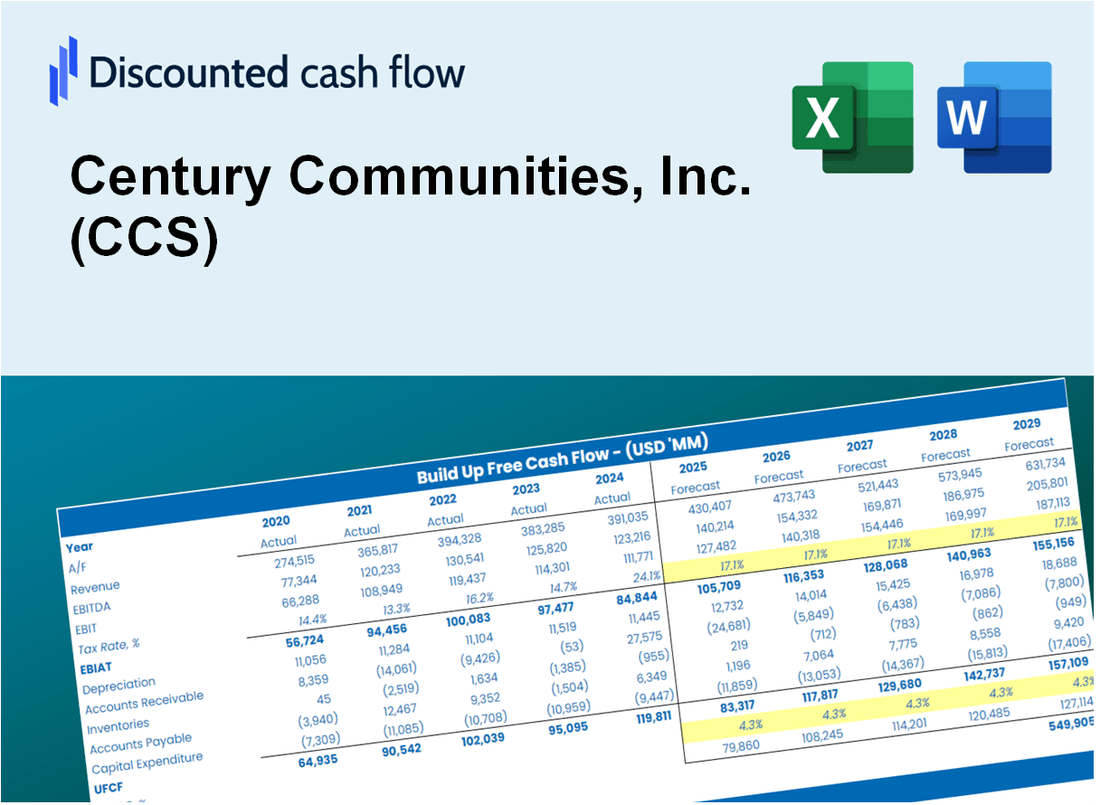
Rationalisez votre analyse et améliorez la précision avec notre calculatrice (CCS) DCF! Équipée de données réelles de Century Communities, Inc. et d'hypothèses personnalisables, cet outil vous permet de prévoir, analyser et évaluer (CCS) comme un investisseur chevronné.
Discounted Cash Flow (DCF) - (USD MM)
| Year | AY1 2020 |
AY2 2021 |
AY3 2022 |
AY4 2023 |
AY5 2024 |
FY1 2025 |
FY2 2026 |
FY3 2027 |
FY4 2028 |
FY5 2029 |
|---|---|---|---|---|---|---|---|---|---|---|
| Revenue | 3,161.2 | 4,216.3 | 4,505.9 | 3,692.2 | 4,398.3 | 4,852.5 | 5,353.7 | 5,906.6 | 6,516.6 | 7,189.6 |
| Revenue Growth, % | 0 | 33.38 | 6.87 | -18.06 | 19.12 | 10.33 | 10.33 | 10.33 | 10.33 | 10.33 |
| EBITDA | 287.8 | 669.6 | 716.1 | 371.4 | 470.6 | 598.2 | 660.0 | 728.1 | 803.3 | 886.3 |
| EBITDA, % | 9.1 | 15.88 | 15.89 | 10.06 | 10.7 | 12.33 | 12.33 | 12.33 | 12.33 | 12.33 |
| Depreciation | 13.1 | 10.9 | 11.2 | 15.8 | 24.3 | 18.5 | 20.4 | 22.5 | 24.8 | 27.4 |
| Depreciation, % | 0.4157 | 0.2588 | 0.24907 | 0.42723 | 0.55217 | 0.38059 | 0.38059 | 0.38059 | 0.38059 | 0.38059 |
| EBIT | 274.6 | 658.7 | 704.9 | 355.7 | 446.3 | 579.7 | 639.6 | 705.6 | 778.5 | 858.9 |
| EBIT, % | 8.69 | 15.62 | 15.64 | 9.63 | 10.15 | 11.95 | 11.95 | 11.95 | 11.95 | 11.95 |
| Total Cash | 394.0 | 316.3 | 296.7 | 226.2 | 150.0 | 350.2 | 386.4 | 426.3 | 470.3 | 518.9 |
| Total Cash, percent | .0 | .0 | .0 | .0 | .0 | .0 | .0 | .0 | .0 | .0 |
| Account Receivables | 21.8 | 41.9 | 52.8 | 76.2 | 50.3 | 58.8 | 64.9 | 71.6 | 79.0 | 87.2 |
| Account Receivables, % | 0.68901 | 0.99452 | 1.17 | 2.06 | 1.14 | 1.21 | 1.21 | 1.21 | 1.21 | 1.21 |
| Inventories | 1,929.7 | 2,456.6 | 2,830.6 | 3,016.6 | 3,454.3 | 3,322.7 | 3,665.9 | 4,044.5 | 4,462.2 | 4,923.0 |
| Inventories, % | 61.04 | 58.26 | 62.82 | 81.7 | 78.54 | 68.47 | 68.47 | 68.47 | 68.47 | 68.47 |
| Accounts Payable | 107.7 | 84.7 | 106.9 | 147.3 | 133.1 | 143.7 | 158.5 | 174.9 | 192.9 | 212.9 |
| Accounts Payable, % | 3.41 | 2.01 | 2.37 | 3.99 | 3.03 | 2.96 | 2.96 | 2.96 | 2.96 | 2.96 |
| Capital Expenditure | -8.5 | -11.6 | -50.7 | -131.7 | -39.0 | -59.4 | -65.5 | -72.3 | -79.8 | -88.0 |
| Capital Expenditure, % | -0.26958 | -0.27455 | -1.13 | -3.57 | -0.88603 | -1.22 | -1.22 | -1.22 | -1.22 | -1.22 |
| Tax Rate, % | 24.14 | 24.14 | 24.14 | 24.14 | 24.14 | 24.14 | 24.14 | 24.14 | 24.14 | 24.14 |
| EBITAT | 209.5 | 512.2 | 546.8 | 262.8 | 338.5 | 442.2 | 487.8 | 538.2 | 593.8 | 655.1 |
| Depreciation | ||||||||||
| Changes in Account Receivables | ||||||||||
| Changes in Inventories | ||||||||||
| Changes in Accounts Payable | ||||||||||
| Capital Expenditure | ||||||||||
| UFCF | -1,629.6 | -58.6 | 144.7 | -22.2 | -102.1 | 534.9 | 108.3 | 119.4 | 131.8 | 145.4 |
| WACC, % | 7.41 | 7.43 | 7.43 | 7.37 | 7.4 | 7.41 | 7.41 | 7.41 | 7.41 | 7.41 |
| PV UFCF | ||||||||||
| SUM PV UFCF | 888.9 | |||||||||
| Long Term Growth Rate, % | 2.00 | |||||||||
| Free cash flow (T + 1) | 148 | |||||||||
| Terminal Value | 2,741 | |||||||||
| Present Terminal Value | 1,917 | |||||||||
| Enterprise Value | 2,806 | |||||||||
| Net Debt | 1,326 | |||||||||
| Equity Value | 1,480 | |||||||||
| Diluted Shares Outstanding, MM | 32 | |||||||||
| Equity Value Per Share | 46.09 |
What You Will Get
- Pre-Filled Financial Model: Century Communities, Inc.’s (CCS) actual data enables precise DCF valuation.
- Full Forecast Control: Adjust revenue growth, margins, WACC, and other key drivers.
- Instant Calculations: Automatic updates ensure you see results as you make changes.
- Investor-Ready Template: A refined Excel file designed for professional-grade valuation.
- Customizable and Reusable: Tailored for flexibility, allowing repeated use for detailed forecasts.
Key Features
- Customizable Financial Inputs: Adjust essential metrics such as home sales growth, profit margins, and construction costs.
- Instant DCF Valuation: Quickly computes intrinsic value, NPV, and additional financial metrics.
- High-Precision Analysis: Leverages Century Communities, Inc.'s (CCS) actual financial data for accurate valuation results.
- Effortless Scenario Testing: Evaluate various assumptions and analyze results with ease.
- Efficiency Booster: Avoid the hassle of creating detailed valuation models from the ground up.
How It Works
- Download: Obtain the comprehensive Excel file featuring Century Communities, Inc.'s (CCS) financial data.
- Customize: Tailor your forecasts, including revenue growth, EBITDA %, and WACC for Century Communities, Inc. (CCS).
- Update Automatically: The intrinsic value and NPV calculations refresh in real-time for Century Communities, Inc. (CCS).
- Test Scenarios: Generate various projections and instantly compare the outcomes for Century Communities, Inc. (CCS).
- Make Decisions: Leverage the valuation results to inform your investment strategy regarding Century Communities, Inc. (CCS).
Why Choose This Calculator for Century Communities, Inc. (CCS)?
- Reliable Data: Access to genuine Century Communities financials guarantees trustworthy valuation outcomes.
- Tailorable: Modify essential variables such as growth rates, WACC, and tax rates to align with your forecasts.
- Efficient: Built-in calculations save you the hassle of starting from the ground up.
- Expert-Level Tool: Crafted for investors, analysts, and consultants in the housing sector.
- Easy to Use: User-friendly design and clear instructions ensure accessibility for all users.
Who Should Use This Product?
- Home Buyers: Gain insights into the housing market and make informed decisions when purchasing a new home from Century Communities, Inc. (CCS).
- Real Estate Investors: Analyze investment opportunities with detailed market data and projections related to Century Communities, Inc. (CCS).
- Realtors: Provide clients with accurate information about new developments and homes offered by Century Communities, Inc. (CCS).
- Market Analysts: Evaluate trends in the housing market and understand the positioning of Century Communities, Inc. (CCS) within the industry.
- Construction Professionals: Learn about innovative building practices and community development strategies employed by Century Communities, Inc. (CCS).
What the Template Contains
- Pre-Filled DCF Model: Century Communities, Inc.'s (CCS) financial data preloaded for immediate use.
- WACC Calculator: Detailed calculations for Weighted Average Cost of Capital.
- Financial Ratios: Evaluate Century Communities, Inc.'s (CCS) profitability, leverage, and efficiency.
- Editable Inputs: Change assumptions such as growth, margins, and CAPEX to fit your scenarios.
- Financial Statements: Annual and quarterly reports to support detailed analysis.
- Interactive Dashboard: Easily visualize key valuation metrics and results.
Disclaimer
All information, articles, and product details provided on this website are for general informational and educational purposes only. We do not claim any ownership over, nor do we intend to infringe upon, any trademarks, copyrights, logos, brand names, or other intellectual property mentioned or depicted on this site. Such intellectual property remains the property of its respective owners, and any references here are made solely for identification or informational purposes, without implying any affiliation, endorsement, or partnership.
We make no representations or warranties, express or implied, regarding the accuracy, completeness, or suitability of any content or products presented. Nothing on this website should be construed as legal, tax, investment, financial, medical, or other professional advice. In addition, no part of this site—including articles or product references—constitutes a solicitation, recommendation, endorsement, advertisement, or offer to buy or sell any securities, franchises, or other financial instruments, particularly in jurisdictions where such activity would be unlawful.
All content is of a general nature and may not address the specific circumstances of any individual or entity. It is not a substitute for professional advice or services. Any actions you take based on the information provided here are strictly at your own risk. You accept full responsibility for any decisions or outcomes arising from your use of this website and agree to release us from any liability in connection with your use of, or reliance upon, the content or products found herein.