
|
Carlyle Secured Lending, Inc. (CGBD) Évaluation DCF |
Entièrement Modifiable: Adapté À Vos Besoins Dans Excel Ou Sheets
Conception Professionnelle: Modèles Fiables Et Conformes Aux Normes Du Secteur
Pré-Construits Pour Une Utilisation Rapide Et Efficace
Compatible MAC/PC, entièrement débloqué
Aucune Expertise N'Est Requise; Facile À Suivre
Carlyle Secured Lending, Inc. (CGBD) Bundle
Conçu pour la précision, notre calculatrice (CGBD) DCF vous permet d'évaluer la valorisation de Carlyle Secured Lending, Inc. en utilisant des données financières du monde réel et offre une flexibilité complète pour modifier tous les paramètres clés pour des projections améliorées.
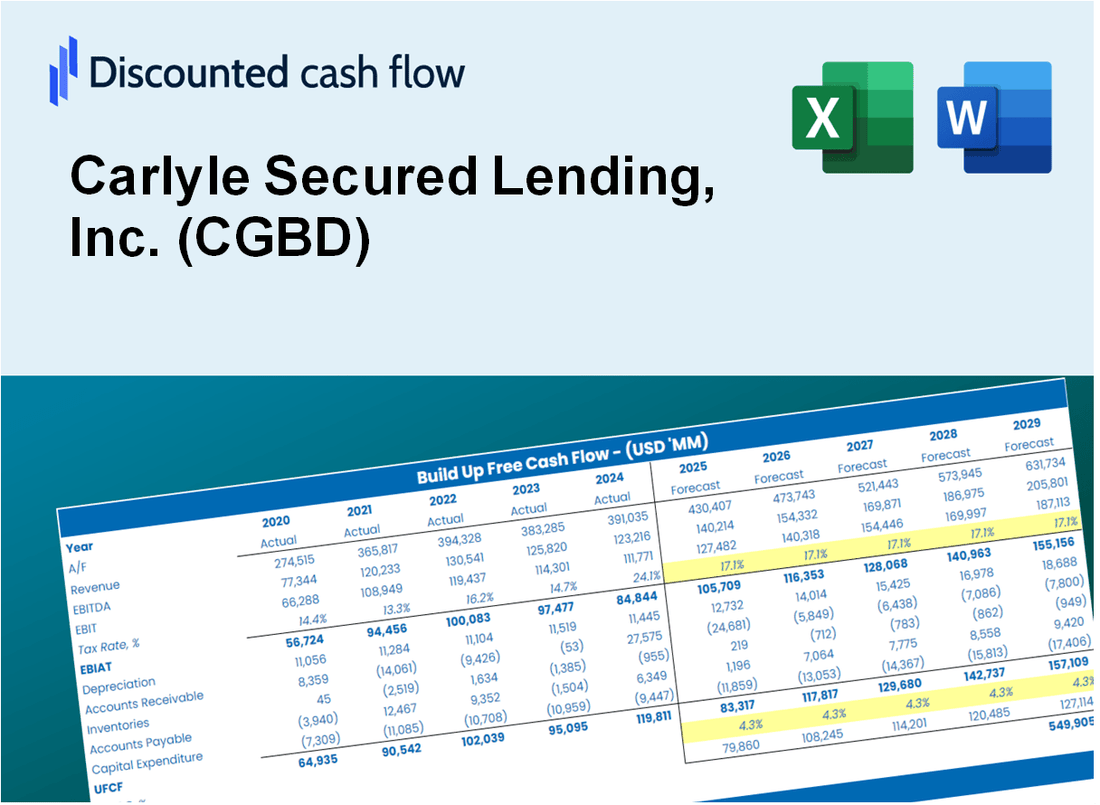
Discounted Cash Flow (DCF) - (USD MM)
| Year | AY1 2020 |
AY2 2021 |
AY3 2022 |
AY4 2023 |
AY5 2024 |
FY1 2025 |
FY2 2026 |
FY3 2027 |
FY4 2028 |
FY5 2029 |
|---|---|---|---|---|---|---|---|---|---|---|
| Revenue | 52.9 | 198.7 | 138.6 | 220.4 | 167.8 | 211.7 | 267.2 | 337.3 | 425.7 | 537.3 |
| Revenue Growth, % | 0 | 275.38 | -30.24 | 58.97 | -23.88 | 26.21 | 26.21 | 26.21 | 26.21 | 26.21 |
| EBITDA | 7.4 | 161.1 | 87.5 | 170.0 | 91.7 | 122.8 | 155.0 | 195.6 | 246.9 | 311.6 |
| EBITDA, % | 13.98 | 81.09 | 63.09 | 77.12 | 54.67 | 57.99 | 57.99 | 57.99 | 57.99 | 57.99 |
| Depreciation | .0 | .0 | .0 | .0 | .0 | .0 | .0 | .0 | .0 | .0 |
| Depreciation, % | 0 | 0 | 0 | 0 | 0 | 0 | 0 | 0 | 0 | 0 |
| EBIT | 7.4 | 161.1 | 87.5 | 170.0 | 91.7 | 122.8 | 155.0 | 195.6 | 246.9 | 311.6 |
| EBIT, % | 13.98 | 81.09 | 63.09 | 77.12 | 54.67 | 57.99 | 57.99 | 57.99 | 57.99 | 57.99 |
| Total Cash | 52.2 | 23.0 | 16.1 | 60.4 | 29.7 | 70.7 | 89.2 | 112.6 | 142.2 | 179.4 |
| Total Cash, percent | .0 | .0 | .0 | .0 | .0 | .0 | .0 | .0 | .0 | .0 |
| Account Receivables | 24.0 | 20.7 | 25.6 | 35.4 | 57.8 | 52.8 | 66.7 | 84.1 | 106.2 | 134.0 |
| Account Receivables, % | 45.33 | 10.4 | 18.43 | 16.06 | 34.48 | 24.94 | 24.94 | 24.94 | 24.94 | 24.94 |
| Inventories | .0 | .0 | .0 | .0 | .0 | .0 | .0 | .0 | .0 | .0 |
| Inventories, % | 0 | 0 | 0 | 0 | 0 | 0 | 0 | 0 | 0 | 0 |
| Accounts Payable | 23.1 | 23.5 | 29.5 | 30.9 | 35.1 | 47.3 | 59.7 | 75.4 | 95.2 | 120.1 |
| Accounts Payable, % | 43.71 | 11.82 | 21.27 | 14.03 | 20.93 | 22.35 | 22.35 | 22.35 | 22.35 | 22.35 |
| Capital Expenditure | .0 | .0 | .0 | .0 | .0 | .0 | .0 | .0 | .0 | .0 |
| Capital Expenditure, % | 0 | 0 | 0 | 0 | 0 | 0 | 0 | 0 | 0 | 0 |
| Tax Rate, % | 2.99 | 2.99 | 2.99 | 2.99 | 2.99 | 2.99 | 2.99 | 2.99 | 2.99 | 2.99 |
| EBITAT | 6.8 | 160.4 | 85.6 | 165.6 | 89.0 | 118.9 | 150.1 | 189.4 | 239.0 | 301.7 |
| Depreciation | ||||||||||
| Changes in Account Receivables | ||||||||||
| Changes in Inventories | ||||||||||
| Changes in Accounts Payable | ||||||||||
| Capital Expenditure | ||||||||||
| UFCF | 6.0 | 164.0 | 86.7 | 157.2 | 70.7 | 136.1 | 148.6 | 187.6 | 236.7 | 298.8 |
| WACC, % | 6.76 | 7.07 | 7 | 6.98 | 6.96 | 6.95 | 6.95 | 6.95 | 6.95 | 6.95 |
| PV UFCF | ||||||||||
| SUM PV UFCF | 804.9 | |||||||||
| Long Term Growth Rate, % | 2.00 | |||||||||
| Free cash flow (T + 1) | 305 | |||||||||
| Terminal Value | 6,152 | |||||||||
| Present Terminal Value | 4,396 | |||||||||
| Enterprise Value | 5,201 | |||||||||
| Net Debt | 938 | |||||||||
| Equity Value | 4,263 | |||||||||
| Diluted Shares Outstanding, MM | 56 | |||||||||
| Equity Value Per Share | 75.49 |
What You Will Get
- Real CGBD Data: Preloaded financials – from revenue to EBIT – based on actual and projected figures for Carlyle Secured Lending, Inc.
- Full Customization: Adjust all critical parameters (yellow cells) like WACC, growth %, and tax rates specific to CGBD.
- Instant Valuation Updates: Automatic recalculations to analyze the impact of changes on Carlyle Secured Lending’s fair value.
- Versatile Excel Template: Tailored for quick edits, scenario testing, and detailed projections for CGBD.
- Time-Saving and Accurate: Skip building models from scratch while maintaining precision and flexibility for Carlyle Secured Lending, Inc.
Key Features
- Comprehensive CGBD Data: Pre-filled with Carlyle Secured Lending's historical performance metrics and future projections.
- Customizable Financial Inputs: Modify parameters such as interest rates, loan growth, credit quality, and operating expenses.
- Adaptive Valuation Framework: Real-time updates to Net Asset Value (NAV) and intrinsic value based on user-defined inputs.
- Scenario Analysis: Develop various financial scenarios to evaluate different investment outcomes.
- Intuitive User Interface: Designed for ease of use, catering to both industry professionals and newcomers.
How It Works
- Step 1: Download the prebuilt Excel template featuring Carlyle Secured Lending, Inc. (CGBD) data.
- Step 2: Review the pre-filled sheets to familiarize yourself with the essential metrics.
- Step 3: Modify forecasts and assumptions in the editable yellow cells (WACC, growth, margins).
- Step 4: Instantly view updated results, including the intrinsic value of Carlyle Secured Lending, Inc. (CGBD).
- Step 5: Utilize the outputs to make informed investment decisions or create detailed reports.
Why Choose Carlyle Secured Lending, Inc. (CGBD) Calculator?
- Accuracy: Utilizes real CGBD financials to ensure precise data.
- Flexibility: Crafted for users to easily test and adjust inputs as needed.
- Time-Saving: Avoid the complexities of creating a lending model from the ground up.
- Professional-Grade: Built with the precision and usability expected at the CFO level.
- User-Friendly: Intuitive interface, accessible even for those lacking advanced financial modeling skills.
Who Should Use This Product?
- Institutional Investors: Develop comprehensive and accurate valuation models for assessing Carlyle Secured Lending, Inc. (CGBD).
- Corporate Finance Teams: Evaluate lending scenarios to inform strategic decision-making.
- Financial Consultants: Deliver precise valuation insights to clients considering investments in Carlyle Secured Lending, Inc. (CGBD).
- Students and Educators: Utilize real-time data to learn and teach about secured lending and financial analysis.
- Market Analysts: Gain insights into how companies like Carlyle Secured Lending, Inc. (CGBD) are valued within the financial sector.
What the Template Contains
- Comprehensive DCF Model: Editable template featuring in-depth valuation calculations for Carlyle Secured Lending, Inc. (CGBD).
- Real-World Data: Historical and projected financials for CGBD preloaded for thorough analysis.
- Customizable Parameters: Modify WACC, growth rates, and tax assumptions to explore various scenarios.
- Financial Statements: Complete annual and quarterly breakdowns for enhanced insights into CGBD's performance.
- Key Ratios: Integrated analysis for profitability, efficiency, and leverage specific to CGBD.
- Dashboard with Visual Outputs: Engaging charts and tables for clear, actionable results regarding CGBD.
Disclaimer
All information, articles, and product details provided on this website are for general informational and educational purposes only. We do not claim any ownership over, nor do we intend to infringe upon, any trademarks, copyrights, logos, brand names, or other intellectual property mentioned or depicted on this site. Such intellectual property remains the property of its respective owners, and any references here are made solely for identification or informational purposes, without implying any affiliation, endorsement, or partnership.
We make no representations or warranties, express or implied, regarding the accuracy, completeness, or suitability of any content or products presented. Nothing on this website should be construed as legal, tax, investment, financial, medical, or other professional advice. In addition, no part of this site—including articles or product references—constitutes a solicitation, recommendation, endorsement, advertisement, or offer to buy or sell any securities, franchises, or other financial instruments, particularly in jurisdictions where such activity would be unlawful.
All content is of a general nature and may not address the specific circumstances of any individual or entity. It is not a substitute for professional advice or services. Any actions you take based on the information provided here are strictly at your own risk. You accept full responsibility for any decisions or outcomes arising from your use of this website and agree to release us from any liability in connection with your use of, or reliance upon, the content or products found herein.