
|
C.H. Robinson Worldwide, Inc. (CHRW) Évaluation DCF |
Entièrement Modifiable: Adapté À Vos Besoins Dans Excel Ou Sheets
Conception Professionnelle: Modèles Fiables Et Conformes Aux Normes Du Secteur
Pré-Construits Pour Une Utilisation Rapide Et Efficace
Compatible MAC/PC, entièrement débloqué
Aucune Expertise N'Est Requise; Facile À Suivre
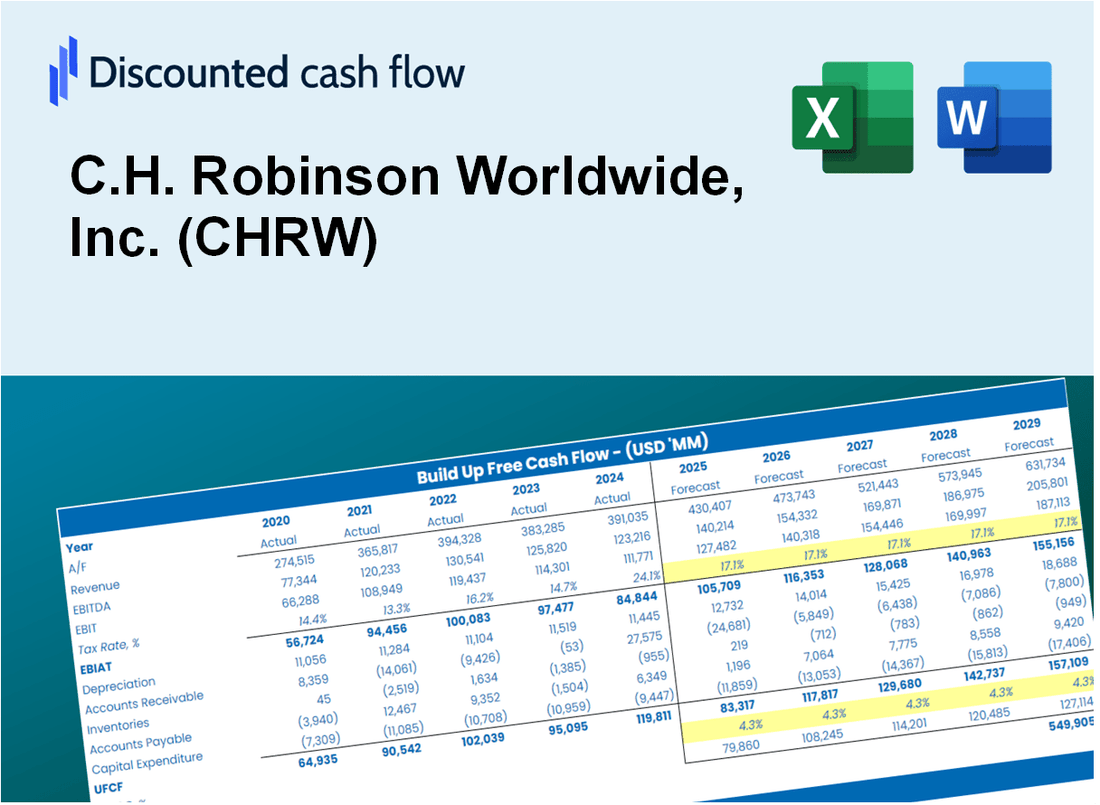
C.H. Robinson Worldwide, Inc. (CHRW) Bundle
Simplifiez C.H. Robinson Worldwide, Inc. (CHRW) Valation avec cette calculatrice DCF personnalisable! Avec le vrai C.H. Robinson Financials et les intrants de prévision réglables, vous pouvez tester des scénarios et découvrir C.H. La juste valeur de Robinson en quelques minutes.
What You Will Get
- Editable Forecast Inputs: Easily modify assumptions (growth %, margins, WACC) to explore various scenarios.
- Real-World Data: C.H. Robinson's financial data pre-filled to expedite your analysis.
- Automatic DCF Outputs: The template computes Net Present Value (NPV) and intrinsic value for you.
- Customizable and Professional: A refined Excel model that adjusts to your valuation requirements.
- Built for Analysts and Investors: Perfect for evaluating projections, confirming strategies, and enhancing efficiency.
Key Features
- Comprehensive Data: C.H. Robinson's historical financial statements and pre-filled forecasts.
- Customizable Inputs: Modify WACC, tax rates, revenue growth, and EBITDA margins as needed.
- Real-Time Insights: Observe C.H. Robinson's intrinsic value recalculating instantly.
- Intuitive Visuals: Dashboard charts illustrate valuation results and essential metrics.
- Designed for Precision: A professional tool tailored for analysts, investors, and finance professionals.
How It Works
- Download the Template: Gain immediate access to the Excel-based CHRW DCF Calculator.
- Input Your Assumptions: Modify the yellow-highlighted cells for growth rates, WACC, margins, and other variables.
- Instant Calculations: The model automatically recalculates C.H. Robinson's intrinsic value.
- Test Scenarios: Experiment with different assumptions to assess potential changes in valuation.
- Analyze and Decide: Utilize the results to inform your investment or financial decision-making.
Why Choose This Calculator for C.H. Robinson Worldwide, Inc. (CHRW)?
- Designed for Industry Experts: A sophisticated tool utilized by logistics managers, financial analysts, and supply chain consultants.
- Accurate Data Integration: C.H. Robinson's historical and projected financials are preloaded for precise analysis.
- Versatile Scenario Analysis: Effortlessly test various logistics scenarios and market assumptions.
- Comprehensive Outputs: Automatically computes intrinsic value, NPV, and essential performance metrics.
- User-Friendly Interface: Step-by-step guidance ensures a seamless experience throughout the calculation process.
Who Should Use This Product?
- Logistics Professionals: Optimize supply chain strategies with accurate data analysis for C.H. Robinson Worldwide, Inc. (CHRW).
- Corporate Operations Teams: Evaluate operational efficiencies to enhance business performance.
- Consultants and Advisors: Deliver precise insights on logistics and transportation solutions for clients.
- Students and Educators: Utilize industry data to learn and teach about logistics management and supply chain principles.
- Business Analysts: Gain a deeper understanding of the logistics sector and market trends impacting C.H. Robinson Worldwide, Inc. (CHRW).
What the Template Contains
- Pre-Filled DCF Model: C.H. Robinson's financial data preloaded for immediate use.
- WACC Calculator: Detailed calculations for Weighted Average Cost of Capital.
- Financial Ratios: Evaluate C.H. Robinson's profitability, leverage, and efficiency.
- Editable Inputs: Change assumptions such as growth, margins, and CAPEX to fit your scenarios.
- Financial Statements: Annual and quarterly reports to support detailed analysis.
- Interactive Dashboard: Easily visualize key valuation metrics and results.
Disclaimer
All information, articles, and product details provided on this website are for general informational and educational purposes only. We do not claim any ownership over, nor do we intend to infringe upon, any trademarks, copyrights, logos, brand names, or other intellectual property mentioned or depicted on this site. Such intellectual property remains the property of its respective owners, and any references here are made solely for identification or informational purposes, without implying any affiliation, endorsement, or partnership.
We make no representations or warranties, express or implied, regarding the accuracy, completeness, or suitability of any content or products presented. Nothing on this website should be construed as legal, tax, investment, financial, medical, or other professional advice. In addition, no part of this site—including articles or product references—constitutes a solicitation, recommendation, endorsement, advertisement, or offer to buy or sell any securities, franchises, or other financial instruments, particularly in jurisdictions where such activity would be unlawful.
All content is of a general nature and may not address the specific circumstances of any individual or entity. It is not a substitute for professional advice or services. Any actions you take based on the information provided here are strictly at your own risk. You accept full responsibility for any decisions or outcomes arising from your use of this website and agree to release us from any liability in connection with your use of, or reliance upon, the content or products found herein.