
|
Columbia Financial, Inc. (CLBK) Évaluation DCF |
Entièrement Modifiable: Adapté À Vos Besoins Dans Excel Ou Sheets
Conception Professionnelle: Modèles Fiables Et Conformes Aux Normes Du Secteur
Pré-Construits Pour Une Utilisation Rapide Et Efficace
Compatible MAC/PC, entièrement débloqué
Aucune Expertise N'Est Requise; Facile À Suivre
Columbia Financial, Inc. (CLBK) Bundle
Découvrez le véritable potentiel de Columbia Financial, Inc. (CLBK) avec notre calculatrice avancée DCF! Ajustez les hypothèses critiques, explorez divers scénarios et évaluez les effets des changements sur l'évaluation de Columbia Financial - le tout dans un seul modèle Excel.
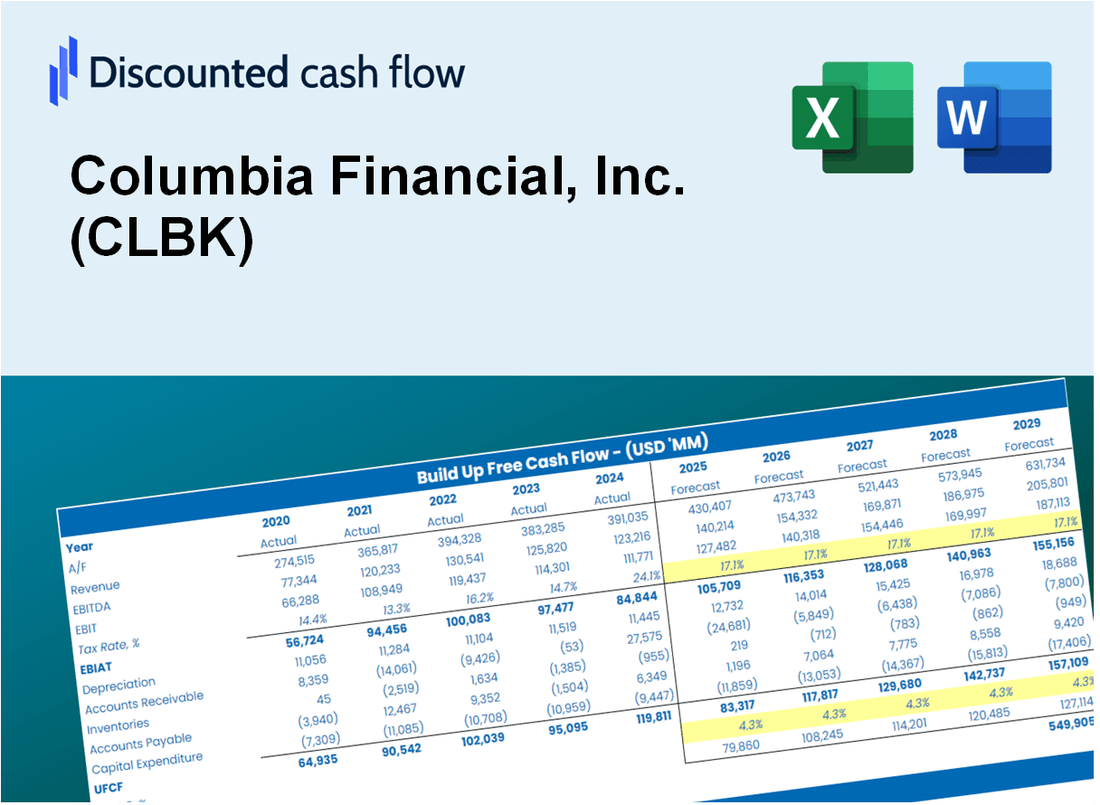
Discounted Cash Flow (DCF) - (USD MM)
| Year | AY1 2020 |
AY2 2021 |
AY3 2022 |
AY4 2023 |
AY5 2024 |
FY1 2025 |
FY2 2026 |
FY3 2027 |
FY4 2028 |
FY5 2029 |
|---|---|---|---|---|---|---|---|---|---|---|
| Revenue | 326.2 | 309.0 | 340.1 | 422.4 | 453.3 | 494.5 | 539.3 | 588.3 | 641.7 | 699.9 |
| Revenue Growth, % | 0 | -5.28 | 10.06 | 24.2 | 7.33 | 9.08 | 9.08 | 9.08 | 9.08 | 9.08 |
| EBITDA | 86.6 | 137.8 | 130.2 | 60.3 | -1.4 | 122.1 | 133.2 | 145.2 | 158.4 | 172.8 |
| EBITDA, % | 26.55 | 44.61 | 38.29 | 14.28 | -0.29846 | 24.69 | 24.69 | 24.69 | 24.69 | 24.69 |
| Depreciation | 10.4 | 11.6 | 13.4 | 14.3 | 14.6 | 17.3 | 18.8 | 20.5 | 22.4 | 24.4 |
| Depreciation, % | 3.18 | 3.77 | 3.93 | 3.38 | 3.21 | 3.49 | 3.49 | 3.49 | 3.49 | 3.49 |
| EBIT | 76.3 | 126.2 | 116.9 | 46.1 | -15.9 | 104.8 | 114.3 | 124.7 | 136.0 | 148.4 |
| EBIT, % | 23.38 | 40.84 | 34.37 | 10.9 | -3.51 | 21.2 | 21.2 | 21.2 | 21.2 | 21.2 |
| Total Cash | 1,739.9 | 1,774.8 | 1,507.9 | 1,516.8 | 438.9 | 491.3 | 535.9 | 584.6 | 637.6 | 695.5 |
| Total Cash, percent | .0 | .0 | .0 | .0 | .0 | .0 | .0 | .0 | .0 | .0 |
| Account Receivables | 29.5 | 28.3 | 33.9 | 39.3 | 40.4 | 45.9 | 50.0 | 54.6 | 59.5 | 64.9 |
| Account Receivables, % | 9.03 | 9.16 | 9.97 | 9.32 | 8.91 | 9.28 | 9.28 | 9.28 | 9.28 | 9.28 |
| Inventories | .0 | .0 | .0 | .0 | .0 | .0 | .0 | .0 | .0 | .0 |
| Inventories, % | 0 | 0 | 0 | 0 | 0 | 0 | 0 | 0 | 0 | 0 |
| Accounts Payable | .0 | .0 | .0 | .0 | .0 | .0 | .0 | .0 | .0 | .0 |
| Accounts Payable, % | 0 | 0 | 0 | 0 | 0 | 0 | 0 | 0 | 0 | 0 |
| Capital Expenditure | -4.6 | -5.5 | -7.2 | -7.6 | -7.4 | -8.7 | -9.5 | -10.3 | -11.2 | -12.3 |
| Capital Expenditure, % | -1.42 | -1.78 | -2.12 | -1.81 | -1.64 | -1.75 | -1.75 | -1.75 | -1.75 | -1.75 |
| Tax Rate, % | 26.76 | 26.76 | 26.76 | 26.76 | 26.76 | 26.76 | 26.76 | 26.76 | 26.76 | 26.76 |
| EBITAT | 57.6 | 92.0 | 86.2 | 36.1 | -11.7 | 78.4 | 85.5 | 93.2 | 101.7 | 110.9 |
| Depreciation | ||||||||||
| Changes in Account Receivables | ||||||||||
| Changes in Inventories | ||||||||||
| Changes in Accounts Payable | ||||||||||
| Capital Expenditure | ||||||||||
| UFCF | 33.9 | 99.4 | 86.7 | 37.3 | -5.6 | 81.5 | 90.7 | 98.9 | 107.9 | 117.7 |
| WACC, % | 10.72 | 10.45 | 10.53 | 11.01 | 10.48 | 10.64 | 10.64 | 10.64 | 10.64 | 10.64 |
| PV UFCF | ||||||||||
| SUM PV UFCF | 363.8 | |||||||||
| Long Term Growth Rate, % | 2.00 | |||||||||
| Free cash flow (T + 1) | 120 | |||||||||
| Terminal Value | 1,390 | |||||||||
| Present Terminal Value | 838 | |||||||||
| Enterprise Value | 1,202 | |||||||||
| Net Debt | 791 | |||||||||
| Equity Value | 411 | |||||||||
| Diluted Shares Outstanding, MM | 102 | |||||||||
| Equity Value Per Share | 4.03 |
What You Will Receive
- Adjustable Financial Inputs: Effortlessly modify assumptions (growth %, margins, WACC) to explore various scenarios.
- Comprehensive Data: Columbia Financial, Inc.’s (CLBK) financial information pre-loaded to facilitate your analysis.
- Automated DCF Calculations: The template computes Net Present Value (NPV) and intrinsic value automatically.
- Tailored and Professional Design: A refined Excel model that can be customized to fit your valuation requirements.
- Designed for Analysts and Investors: Perfect for evaluating forecasts, confirming strategies, and enhancing efficiency.
Key Features
- 🔍 Real-Life CLBK Financials: Pre-filled historical and projected data for Columbia Financial, Inc.
- ✏️ Fully Customizable Inputs: Adjust all critical parameters (yellow cells) like WACC, growth %, and tax rates.
- 📊 Professional DCF Valuation: Built-in formulas calculate Columbia’s intrinsic value using the Discounted Cash Flow method.
- ⚡ Instant Results: Visualize Columbia’s valuation instantly after making changes.
- Scenario Analysis: Test and compare outcomes for various financial assumptions side-by-side.
How It Works
- Step 1: Download the prebuilt Excel template featuring Columbia Financial, Inc.'s (CLBK) data.
- Step 2: Navigate through the pre-filled sheets to familiarize yourself with the essential metrics.
- Step 3: Modify forecasts and assumptions in the editable yellow cells (WACC, growth, margins).
- Step 4: Instantly view updated results, including Columbia Financial, Inc.'s (CLBK) intrinsic value.
- Step 5: Utilize the outputs to make informed investment decisions or create comprehensive reports.
Why Choose Columbia Financial, Inc. (CLBK) Calculator?
- All-in-One Solution: Combines DCF, WACC, and financial ratio analyses for comprehensive evaluation.
- Flexible Inputs: Modify the highlighted cells to explore different financial scenarios.
- In-Depth Analysis: Automatically computes Columbia Financial’s intrinsic value and Net Present Value.
- Preloaded Information: Access to historical and projected data for reliable analysis.
- Expert-Level Tool: Perfect for financial analysts, investors, and business advisors.
Who Should Use This Product?
- Investors: Assess Columbia Financial, Inc.'s (CLBK) performance before making investment decisions.
- CFOs and Financial Analysts: Optimize valuation methodologies and evaluate financial forecasts.
- Startup Founders: Understand the valuation strategies of established financial institutions like Columbia Financial, Inc.
- Consultants: Provide comprehensive valuation assessments for your clients.
- Students and Educators: Utilize current market data to learn and teach financial valuation principles.
What the Template Contains
- Pre-Filled Data: Features Columbia Financial, Inc.'s (CLBK) historical financials and projections.
- Discounted Cash Flow Model: An editable DCF valuation model with automated calculations.
- Weighted Average Cost of Capital (WACC): A dedicated sheet for computing WACC based on user-defined inputs.
- Key Financial Ratios: Assess Columbia Financial, Inc.'s (CLBK) profitability, efficiency, and leverage metrics.
- Customizable Inputs: Easily modify revenue growth, profit margins, and tax rates.
- Clear Dashboard: Visuals and tables summarizing essential valuation outcomes.
Disclaimer
All information, articles, and product details provided on this website are for general informational and educational purposes only. We do not claim any ownership over, nor do we intend to infringe upon, any trademarks, copyrights, logos, brand names, or other intellectual property mentioned or depicted on this site. Such intellectual property remains the property of its respective owners, and any references here are made solely for identification or informational purposes, without implying any affiliation, endorsement, or partnership.
We make no representations or warranties, express or implied, regarding the accuracy, completeness, or suitability of any content or products presented. Nothing on this website should be construed as legal, tax, investment, financial, medical, or other professional advice. In addition, no part of this site—including articles or product references—constitutes a solicitation, recommendation, endorsement, advertisement, or offer to buy or sell any securities, franchises, or other financial instruments, particularly in jurisdictions where such activity would be unlawful.
All content is of a general nature and may not address the specific circumstances of any individual or entity. It is not a substitute for professional advice or services. Any actions you take based on the information provided here are strictly at your own risk. You accept full responsibility for any decisions or outcomes arising from your use of this website and agree to release us from any liability in connection with your use of, or reliance upon, the content or products found herein.