
|
Cambium Networks Corporation (CMBM) Évaluation DCF |
Entièrement Modifiable: Adapté À Vos Besoins Dans Excel Ou Sheets
Conception Professionnelle: Modèles Fiables Et Conformes Aux Normes Du Secteur
Pré-Construits Pour Une Utilisation Rapide Et Efficace
Compatible MAC/PC, entièrement débloqué
Aucune Expertise N'Est Requise; Facile À Suivre
Cambium Networks Corporation (CMBM) Bundle
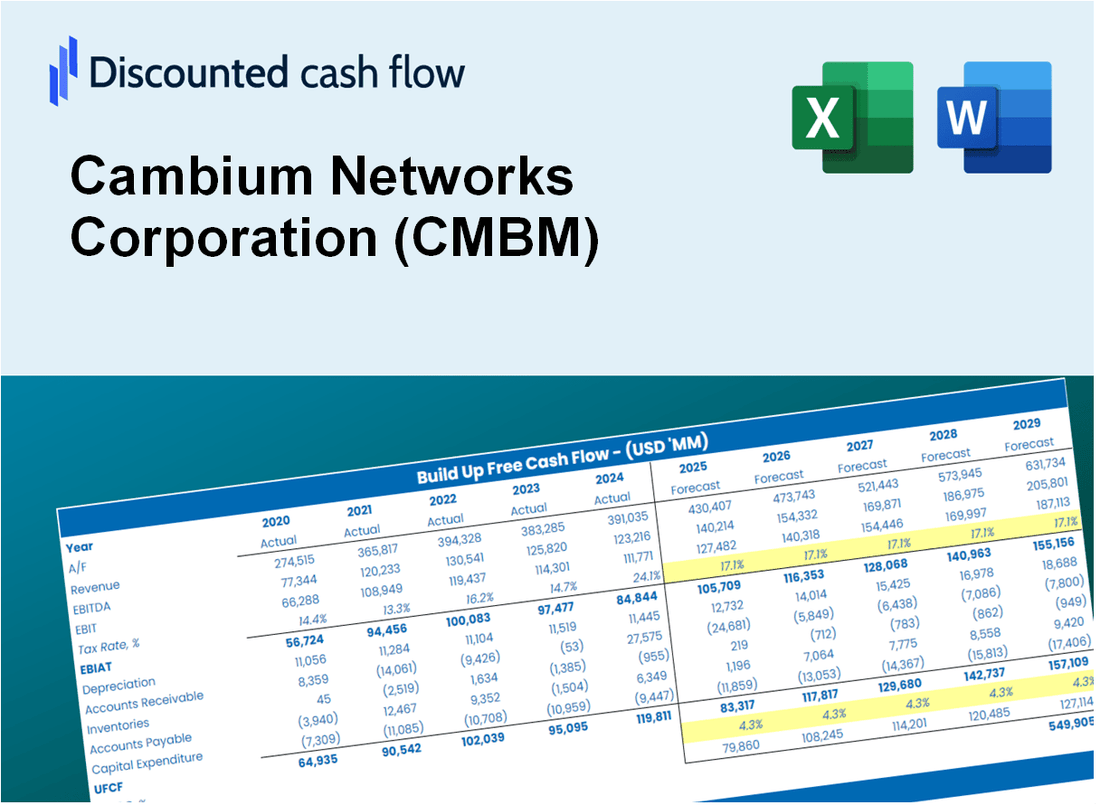
Découvrez le véritable potentiel de Cambium Networks Corporation (CMBM) avec notre calculatrice avancée DCF! Ajustez les hypothèses essentielles, explorez divers scénarios et évaluez comment différents facteurs influencent l'évaluation des réseaux de cambium - le tout dans un modèle Excel pratique.
What You Will Get
- Comprehensive CMBM Financials: Access both historical and projected data for precise valuation.
- Customizable Inputs: Adjust WACC, tax rates, revenue growth, and capital expenditures as needed.
- Dynamic Calculations: Intrinsic value and NPV are computed in real-time.
- Scenario Analysis: Explore various scenarios to assess Cambium's future performance.
- User-Friendly Design: Designed for professionals while remaining approachable for newcomers.
Key Features
- Real-Time CMBM Data: Pre-loaded with Cambium Networks' historical performance metrics and future projections.
- Customizable Assumptions: Modify parameters such as revenue growth, profit margins, discount rates, tax considerations, and capital investments.
- Adaptive Valuation Framework: Automatically recalculates Net Present Value (NPV) and intrinsic value based on user-defined inputs.
- Scenario Analysis: Develop various forecasting scenarios to explore different valuation possibilities.
- Intuitive Interface: Designed to be straightforward and accessible for both seasoned professionals and newcomers.
How It Works
- Step 1: Download the prebuilt Excel template with Cambium Networks Corporation’s (CMBM) data included.
- Step 2: Explore the pre-filled sheets and understand the key metrics relevant to (CMBM).
- Step 3: Update forecasts and assumptions in the editable yellow cells (WACC, growth, margins) specific to (CMBM).
- Step 4: Instantly view recalculated results, including Cambium Networks Corporation’s (CMBM) intrinsic value.
- Step 5: Make informed investment decisions or generate reports using the outputs related to (CMBM).
Why Choose This Calculator for Cambium Networks Corporation (CMBM)?
- User-Friendly Interface: Tailored for both novices and seasoned professionals.
- Customizable Inputs: Adjust parameters easily to suit your financial analysis.
- Real-Time Updates: Observe immediate changes in Cambium Networks’ valuation as you modify inputs.
- Pre-Loaded Data: Comes equipped with Cambium Networks’ actual financial information for swift evaluations.
- Relied Upon by Experts: Utilized by investors and analysts for making well-informed choices.
Who Should Use This Product?
- Network Engineers: Develop comprehensive network design models for performance evaluation.
- Telecommunications Professionals: Assess valuation scenarios to inform strategic decisions.
- Consultants and Advisors: Deliver precise valuation insights for Cambium Networks Corporation (CMBM) stock.
- Students and Educators: Utilize real-world data to enhance learning in networking and finance.
- Technology Investors: Gain insights into how networking companies like Cambium Networks Corporation (CMBM) are valued in the industry.
What the Template Contains
- Pre-Filled DCF Model: Cambium Networks Corporation's (CMBM) financial data preloaded for immediate use.
- WACC Calculator: Detailed calculations for Weighted Average Cost of Capital.
- Financial Ratios: Evaluate Cambium Networks Corporation's (CMBM) profitability, leverage, and efficiency.
- Editable Inputs: Change assumptions such as growth, margins, and CAPEX to fit your scenarios.
- Financial Statements: Annual and quarterly reports to support detailed analysis.
- Interactive Dashboard: Easily visualize key valuation metrics and results.
Disclaimer
All information, articles, and product details provided on this website are for general informational and educational purposes only. We do not claim any ownership over, nor do we intend to infringe upon, any trademarks, copyrights, logos, brand names, or other intellectual property mentioned or depicted on this site. Such intellectual property remains the property of its respective owners, and any references here are made solely for identification or informational purposes, without implying any affiliation, endorsement, or partnership.
We make no representations or warranties, express or implied, regarding the accuracy, completeness, or suitability of any content or products presented. Nothing on this website should be construed as legal, tax, investment, financial, medical, or other professional advice. In addition, no part of this site—including articles or product references—constitutes a solicitation, recommendation, endorsement, advertisement, or offer to buy or sell any securities, franchises, or other financial instruments, particularly in jurisdictions where such activity would be unlawful.
All content is of a general nature and may not address the specific circumstances of any individual or entity. It is not a substitute for professional advice or services. Any actions you take based on the information provided here are strictly at your own risk. You accept full responsibility for any decisions or outcomes arising from your use of this website and agree to release us from any liability in connection with your use of, or reliance upon, the content or products found herein.