
|
Composecure, Inc. (CMPO) Évaluation DCF |
Entièrement Modifiable: Adapté À Vos Besoins Dans Excel Ou Sheets
Conception Professionnelle: Modèles Fiables Et Conformes Aux Normes Du Secteur
Pré-Construits Pour Une Utilisation Rapide Et Efficace
Compatible MAC/PC, entièrement débloqué
Aucune Expertise N'Est Requise; Facile À Suivre
CompoSecure, Inc. (CMPO) Bundle
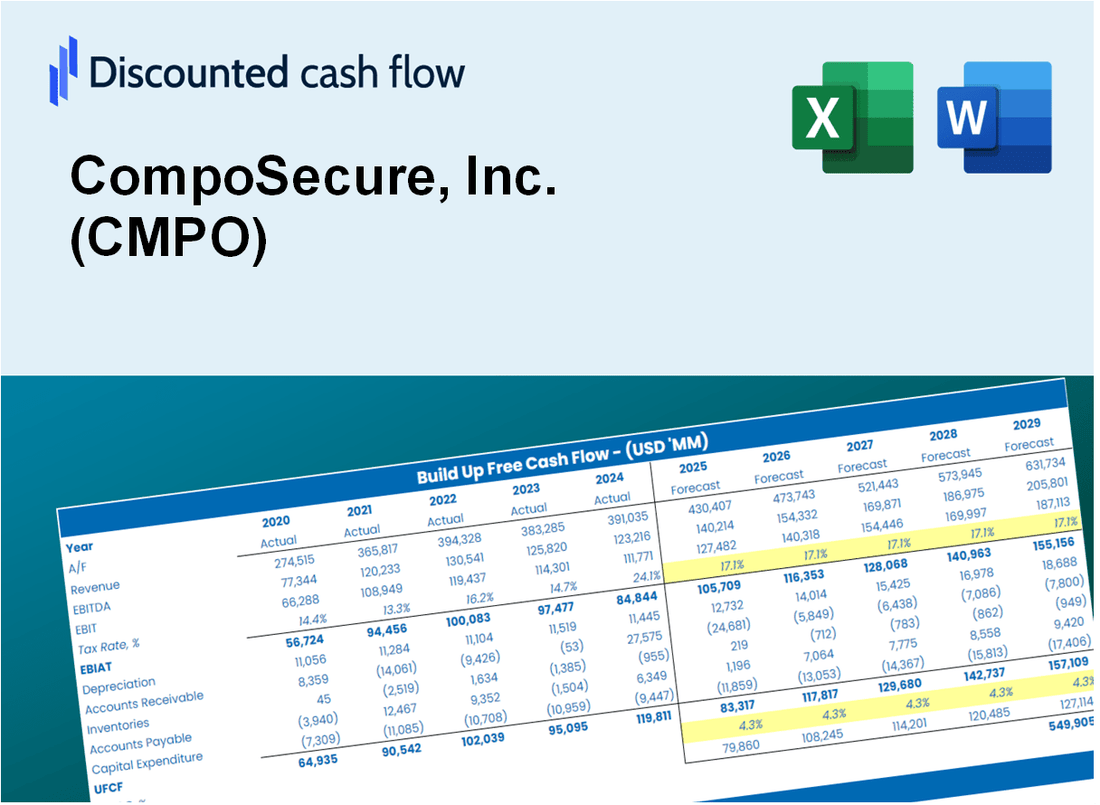
Conçu pour la précision, notre calculatrice (CMPO) DCF vous permet d'évaluer l'évaluation ComposeCure, Inc. à l'aide de données financières réelles, offrant une flexibilité complète pour modifier tous les paramètres essentiels pour des projections améliorées.
What You Will Get
- Editable Excel Template: A fully customizable Excel-based DCF Calculator featuring pre-filled real CMPO financials.
- Real-World Data: Historical data and forward-looking estimates (as indicated in the yellow cells).
- Forecast Flexibility: Adjust forecast assumptions such as revenue growth, EBITDA %, and WACC.
- Automatic Calculations: Instantly observe how your inputs affect CompoSecure’s valuation.
- Professional Tool: Designed for investors, CFOs, consultants, and financial analysts.
- User-Friendly Design: Organized for clarity and ease of use, complete with step-by-step instructions.
Key Features
- 🔍 Real-Life CMPO Financials: Pre-filled historical and projected data for CompoSecure, Inc.
- ✏️ Fully Customizable Inputs: Adjust all critical parameters (yellow cells) like WACC, growth %, and tax rates.
- 📊 Professional DCF Valuation: Built-in formulas calculate CompoSecure’s intrinsic value using the Discounted Cash Flow method.
- ⚡ Instant Results: Visualize CompoSecure’s valuation instantly after making changes.
- Scenario Analysis: Test and compare outcomes for various financial assumptions side-by-side.
How It Works
- Step 1: Download the prebuilt Excel template featuring CompoSecure’s data.
- Step 2: Navigate through the pre-filled sheets to grasp the essential metrics.
- Step 3: Modify forecasts and assumptions in the editable yellow cells (WACC, growth, margins).
- Step 4: Instantly view the updated results, including CompoSecure’s intrinsic value.
- Step 5: Make well-informed investment decisions or create reports based on the outputs.
Why Choose This Calculator for CompoSecure, Inc. (CMPO)?
- User-Friendly Interface: Crafted for both novices and seasoned users.
- Customizable Inputs: Adjust variables easily to suit your financial analysis.
- Real-Time Feedback: Observe immediate updates to CompoSecure’s valuation as you modify inputs.
- Preloaded Data: Comes with CompoSecure’s actual financial metrics for swift evaluations.
- Favored by Experts: Employed by investors and analysts for sound decision-making.
Who Should Use CompoSecure, Inc. (CMPO)?
- Investors: Gain insights and make informed decisions with cutting-edge security solutions.
- Financial Analysts: Streamline your analysis with comprehensive data and reporting tools tailored for the industry.
- Consultants: Easily customize presentations and reports with our innovative technology offerings.
- Tech Enthusiasts: Explore advanced security technologies and their applications in real-world scenarios.
- Educators and Students: Utilize our resources as a hands-on learning tool in technology and finance courses.
What the Template Contains
- Comprehensive DCF Model: Editable template featuring detailed valuation calculations for CompoSecure, Inc. (CMPO).
- Real-World Data: CompoSecure's historical and projected financials preloaded for thorough analysis.
- Customizable Parameters: Modify WACC, growth rates, and tax assumptions to explore various scenarios.
- Financial Statements: Complete annual and quarterly breakdowns for enhanced insights into performance.
- Key Ratios: Integrated analysis for profitability, efficiency, and leverage specific to CompoSecure, Inc. (CMPO).
- Dashboard with Visual Outputs: Engaging charts and tables for clear, actionable results.
Disclaimer
All information, articles, and product details provided on this website are for general informational and educational purposes only. We do not claim any ownership over, nor do we intend to infringe upon, any trademarks, copyrights, logos, brand names, or other intellectual property mentioned or depicted on this site. Such intellectual property remains the property of its respective owners, and any references here are made solely for identification or informational purposes, without implying any affiliation, endorsement, or partnership.
We make no representations or warranties, express or implied, regarding the accuracy, completeness, or suitability of any content or products presented. Nothing on this website should be construed as legal, tax, investment, financial, medical, or other professional advice. In addition, no part of this site—including articles or product references—constitutes a solicitation, recommendation, endorsement, advertisement, or offer to buy or sell any securities, franchises, or other financial instruments, particularly in jurisdictions where such activity would be unlawful.
All content is of a general nature and may not address the specific circumstances of any individual or entity. It is not a substitute for professional advice or services. Any actions you take based on the information provided here are strictly at your own risk. You accept full responsibility for any decisions or outcomes arising from your use of this website and agree to release us from any liability in connection with your use of, or reliance upon, the content or products found herein.