
|
Centessa Pharmaceuticals plc (CNTA) DCF Valuation |
Entièrement Modifiable: Adapté À Vos Besoins Dans Excel Ou Sheets
Conception Professionnelle: Modèles Fiables Et Conformes Aux Normes Du Secteur
Pré-Construits Pour Une Utilisation Rapide Et Efficace
Compatible MAC/PC, entièrement débloqué
Aucune Expertise N'Est Requise; Facile À Suivre
Centessa Pharmaceuticals plc (CNTA) Bundle
Discover the true value of Centessa Pharmaceuticals plc with our professional-grade DCF Calculator! Adjust key assumptions, explore various scenarios, and examine how changes affect Centessa Pharmaceuticals plc (CNTA) valuation – all within a single Excel template.
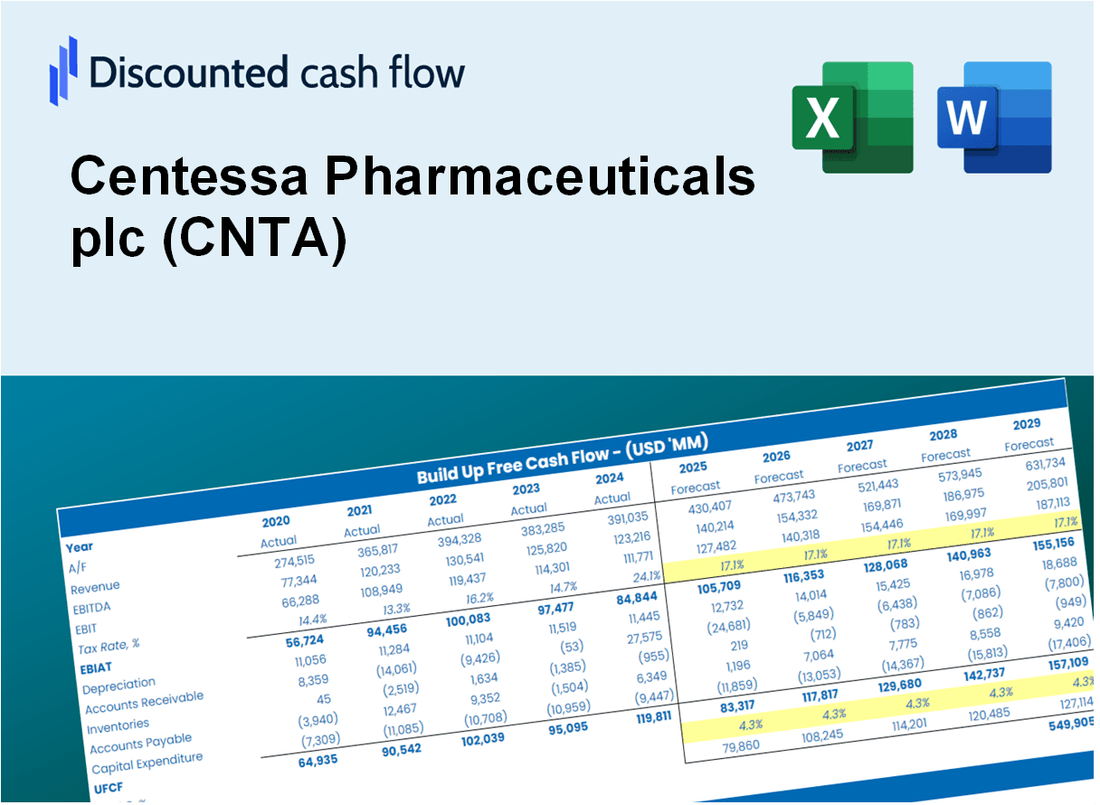
Discounted Cash Flow (DCF) - (USD MM)
| Year | AY1 2020 |
AY2 2021 |
AY3 2022 |
AY4 2023 |
AY5 2024 |
FY1 2025 |
FY2 2026 |
FY3 2027 |
FY4 2028 |
FY5 2029 |
|---|---|---|---|---|---|---|---|---|---|---|
| Revenue | .0 | .0 | .0 | 6.9 | .0 | .0 | .0 | .0 | .0 | .0 |
| Revenue Growth, % | 0 | 0 | 0 | 0 | -100 | -25 | -25 | -25 | -25 | -25 |
| EBITDA | -10.3 | -139.3 | -209.5 | -165.4 | -221.9 | .0 | .0 | .0 | .0 | .0 |
| EBITDA, % | 100 | 100 | 100 | -2413.91 | 100 | 60 | 60 | 60 | 60 | 60 |
| Depreciation | .0 | .0 | .1 | .8 | .9 | .0 | .0 | .0 | .0 | .0 |
| Depreciation, % | 100 | 100 | 100 | 11.82 | 100 | 82.36 | 82.36 | 82.36 | 82.36 | 82.36 |
| EBIT | -10.3 | -139.3 | -209.7 | -166.2 | -222.8 | .0 | .0 | .0 | .0 | .0 |
| EBIT, % | 100 | 100 | 100 | -2425.73 | 100 | 60 | 60 | 60 | 60 | 60 |
| Total Cash | 7.2 | 595.1 | 393.6 | 256.5 | 482.2 | .0 | .0 | .0 | .0 | .0 |
| Total Cash, percent | .0 | .0 | .0 | .0 | .0 | .0 | .0 | .0 | .0 | .0 |
| Account Receivables | .0 | 16.8 | 26.7 | 39.1 | 45.3 | .0 | .0 | .0 | .0 | .0 |
| Account Receivables, % | 100 | 100 | 100 | 571.25 | 100 | 100 | 100 | 100 | 100 | 100 |
| Inventories | .0 | .0 | .0 | .0 | .0 | .0 | .0 | .0 | .0 | .0 |
| Inventories, % | 100 | 100 | 100 | 0 | 100 | 80 | 80 | 80 | 80 | 80 |
| Accounts Payable | 1.0 | 8.1 | 13.8 | 11.8 | 7.1 | .0 | .0 | .0 | .0 | .0 |
| Accounts Payable, % | 100 | 100 | 100 | 172.41 | 100 | 100 | 100 | 100 | 100 | 100 |
| Capital Expenditure | .0 | -.2 | -1.1 | -.2 | .0 | .0 | .0 | .0 | .0 | .0 |
| Capital Expenditure, % | 100 | 100 | 100 | -2.47 | 100 | -0.49321 | -0.49321 | -0.49321 | -0.49321 | -0.49321 |
| Tax Rate, % | -1.22 | -1.22 | -1.22 | -1.22 | -1.22 | -1.22 | -1.22 | -1.22 | -1.22 | -1.22 |
| EBITAT | -10.3 | -139.4 | -209.0 | -142.6 | -225.5 | .0 | .0 | .0 | .0 | .0 |
| Depreciation | ||||||||||
| Changes in Account Receivables | ||||||||||
| Changes in Inventories | ||||||||||
| Changes in Accounts Payable | ||||||||||
| Capital Expenditure | ||||||||||
| UFCF | -9.3 | -149.3 | -214.1 | -156.4 | -235.5 | 38.2 | .0 | .0 | .0 | .0 |
| WACC, % | 10.96 | 10.96 | 10.96 | 10.91 | 10.96 | 10.95 | 10.95 | 10.95 | 10.95 | 10.95 |
| PV UFCF | ||||||||||
| SUM PV UFCF | 34.4 | |||||||||
| Long Term Growth Rate, % | 2.00 | |||||||||
| Free cash flow (T + 1) | 0 | |||||||||
| Terminal Value | 0 | |||||||||
| Present Terminal Value | 0 | |||||||||
| Enterprise Value | 34 | |||||||||
| Net Debt | -266 | |||||||||
| Equity Value | 300 | |||||||||
| Diluted Shares Outstanding, MM | 114 | |||||||||
| Equity Value Per Share | 2.62 |
What You Will Receive
- Comprehensive Financial Model: Centessa Pharmaceuticals’ actual data facilitates accurate DCF valuation.
- Complete Forecast Control: Modify revenue growth, profit margins, WACC, and other essential parameters.
- Real-Time Calculations: Automatic updates provide immediate results as you make adjustments.
- Professional-Grade Template: A polished Excel file crafted for high-quality valuation.
- Flexible and Reusable: Designed for adaptability, allowing for repeated use in detailed financial forecasts.
Key Features
- Comprehensive Financial Data: Gain access to precise historical data and future forecasts for Centessa Pharmaceuticals plc (CNTA).
- Adjustable Forecast Parameters: Modify highlighted fields such as discount rates, growth projections, and profit margins.
- Automated Calculations: Instant updates for DCF, Net Present Value (NPV), and cash flow assessments.
- User-Friendly Dashboard: Clear visualizations and summaries to present your valuation findings effectively.
- Suitable for All Experience Levels: An intuitive layout designed for investors, CFOs, and consultants alike.
How It Works
- Download: Obtain the pre-configured Excel file containing Centessa Pharmaceuticals plc’s (CNTA) financial data.
- Customize: Modify projections, including revenue growth, EBITDA %, and WACC as per your analysis.
- Update Automatically: The intrinsic value and NPV calculations refresh in real-time for accurate insights.
- Test Scenarios: Generate various forecasts and instantly compare the results.
- Make Decisions: Leverage the valuation outcomes to inform your investment approach.
Why Choose This Calculator for Centessa Pharmaceuticals plc (CNTA)?
- All-in-One Solution: Combines DCF, WACC, and financial ratio analyses tailored for Centessa Pharmaceuticals.
- Flexible Inputs: Modify yellow-highlighted cells to explore different financial scenarios for (CNTA).
- In-Depth Analysis: Automatically computes Centessa’s intrinsic value and Net Present Value.
- Preloaded Information: Access to historical and projected data for precise calculations.
- Expert-Level Tool: Perfect for financial analysts, investors, and consultants focusing on (CNTA).
Who Should Use This Product?
- Investors: Accurately assess Centessa Pharmaceuticals' fair value before making investment choices.
- CFOs: Utilize a professional-grade DCF model for financial reporting and analysis specific to Centessa Pharmaceuticals (CNTA).
- Consultants: Efficiently customize the template for valuation reports tailored to Centessa Pharmaceuticals (CNTA) clients.
- Entrepreneurs: Acquire insights into financial modeling practices employed by leading pharmaceutical companies.
- Educators: Implement it as a teaching resource to illustrate valuation methodologies in the pharmaceutical sector.
What the Template Contains
- Pre-Filled Data: Includes Centessa Pharmaceuticals plc's historical financials and projections.
- Discounted Cash Flow Model: Editable DCF valuation model with automatic computations.
- Weighted Average Cost of Capital (WACC): A dedicated sheet for calculating WACC based on tailored inputs.
- Key Financial Ratios: Assess Centessa Pharmaceuticals plc's profitability, efficiency, and leverage.
- Customizable Inputs: Easily modify revenue growth, margins, and tax rates.
- Clear Dashboard: Visual representations and tables summarizing key valuation outcomes.
Disclaimer
All information, articles, and product details provided on this website are for general informational and educational purposes only. We do not claim any ownership over, nor do we intend to infringe upon, any trademarks, copyrights, logos, brand names, or other intellectual property mentioned or depicted on this site. Such intellectual property remains the property of its respective owners, and any references here are made solely for identification or informational purposes, without implying any affiliation, endorsement, or partnership.
We make no representations or warranties, express or implied, regarding the accuracy, completeness, or suitability of any content or products presented. Nothing on this website should be construed as legal, tax, investment, financial, medical, or other professional advice. In addition, no part of this site—including articles or product references—constitutes a solicitation, recommendation, endorsement, advertisement, or offer to buy or sell any securities, franchises, or other financial instruments, particularly in jurisdictions where such activity would be unlawful.
All content is of a general nature and may not address the specific circumstances of any individual or entity. It is not a substitute for professional advice or services. Any actions you take based on the information provided here are strictly at your own risk. You accept full responsibility for any decisions or outcomes arising from your use of this website and agree to release us from any liability in connection with your use of, or reliance upon, the content or products found herein.