
|
Cochin Shipyard Limited (Cochinship.NS) Évaluation DCF |
Entièrement Modifiable: Adapté À Vos Besoins Dans Excel Ou Sheets
Conception Professionnelle: Modèles Fiables Et Conformes Aux Normes Du Secteur
Pré-Construits Pour Une Utilisation Rapide Et Efficace
Compatible MAC/PC, entièrement débloqué
Aucune Expertise N'Est Requise; Facile À Suivre
Cochin Shipyard Limited (COCHINSHIP.NS) Bundle
Améliorez vos choix d'investissement avec la calculatrice DCF (Cochinships)! Explorez de véritables données financières pour Cochin Shipyard Limited, ajustez les projections et dépenses de croissance et observez instantanément comment ces modifications affectent la valeur intrinsèque de (Cochinshipns).
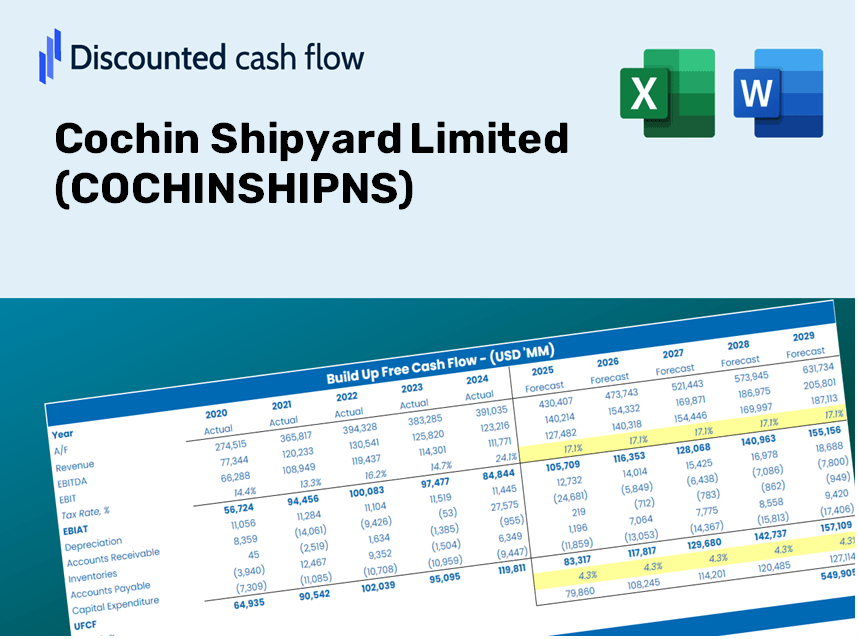
Discounted Cash Flow (DCF) - (USD MM)
| Year | AY1 2021 |
AY2 2022 |
AY3 2023 |
AY4 2024 |
AY5 2025 |
FY1 2026 |
FY2 2027 |
FY3 2028 |
FY4 2029 |
FY5 2030 |
|---|---|---|---|---|---|---|---|---|---|---|
| Revenue | 28,190.3 | 31,911.9 | 23,647.3 | 38,306.8 | 48,201.1 | 57,253.9 | 68,007.0 | 80,779.5 | 95,951.0 | 113,971.8 |
| Revenue Growth, % | 0 | 13.2 | -25.9 | 61.99 | 25.83 | 18.78 | 18.78 | 18.78 | 18.78 | 18.78 |
| EBITDA | 7,829.3 | 7,311.9 | 3,395.6 | 8,907.7 | 10,274.7 | 12,551.8 | 14,909.2 | 17,709.3 | 21,035.4 | 24,986.1 |
| EBITDA, % | 27.77 | 22.91 | 14.36 | 23.25 | 21.32 | 21.92 | 21.92 | 21.92 | 21.92 | 21.92 |
| Depreciation | 430.6 | 504.7 | 688.4 | 458.9 | 745.8 | 1,003.7 | 1,192.2 | 1,416.2 | 1,682.1 | 1,998.0 |
| Depreciation, % | 1.53 | 1.58 | 2.91 | 1.2 | 1.55 | 1.75 | 1.75 | 1.75 | 1.75 | 1.75 |
| EBIT | 7,398.7 | 6,807.2 | 2,707.2 | 8,448.9 | 9,528.8 | 11,548.1 | 13,716.9 | 16,293.2 | 19,353.2 | 22,988.0 |
| EBIT, % | 26.25 | 21.33 | 11.45 | 22.06 | 19.77 | 20.17 | 20.17 | 20.17 | 20.17 | 20.17 |
| Total Cash | 7,357.1 | 32,126.7 | 47,922.3 | 5,771.2 | 4,022.1 | 28,570.6 | 33,936.6 | 40,310.3 | 47,881.1 | 56,873.8 |
| Total Cash, percent | .0 | .0 | .0 | .0 | .0 | .0 | .0 | .0 | .0 | .0 |
| Account Receivables | 13,047.6 | 8,032.6 | 12,328.1 | 20,514.6 | 2,303.4 | 20,831.3 | 24,743.7 | 29,390.9 | 34,910.9 | 41,467.6 |
| Account Receivables, % | 46.28 | 25.17 | 52.13 | 53.55 | 4.78 | 36.38 | 36.38 | 36.38 | 36.38 | 36.38 |
| Inventories | 4,341.0 | 2,983.6 | 3,730.0 | 10,260.9 | 18,851.1 | 12,185.6 | 14,474.2 | 17,192.7 | 20,421.7 | 24,257.1 |
| Inventories, % | 15.4 | 9.35 | 15.77 | 26.79 | 39.11 | 21.28 | 21.28 | 21.28 | 21.28 | 21.28 |
| Accounts Payable | 4,354.3 | 3,761.3 | 2,164.8 | 4,651.2 | 5,013.8 | 6,748.1 | 8,015.5 | 9,520.9 | 11,309.0 | 13,433.0 |
| Accounts Payable, % | 15.45 | 11.79 | 9.15 | 12.14 | 10.4 | 11.79 | 11.79 | 11.79 | 11.79 | 11.79 |
| Capital Expenditure | -4,297.0 | -2,630.5 | -3,443.7 | -6,338.2 | -4,960.9 | -7,430.0 | -8,825.5 | -10,483.0 | -12,451.9 | -14,790.5 |
| Capital Expenditure, % | -15.24 | -8.24 | -14.56 | -16.55 | -10.29 | -12.98 | -12.98 | -12.98 | -12.98 | -12.98 |
| Tax Rate, % | 26.47 | 26.47 | 26.47 | 26.47 | 26.47 | 26.47 | 26.47 | 26.47 | 26.47 | 26.47 |
| EBITAT | 5,572.5 | 5,012.1 | 1,971.4 | 6,179.4 | 7,006.5 | 8,509.5 | 10,107.7 | 12,006.0 | 14,260.9 | 16,939.3 |
| Depreciation | ||||||||||
| Changes in Account Receivables | ||||||||||
| Changes in Inventories | ||||||||||
| Changes in Accounts Payable | ||||||||||
| Capital Expenditure | ||||||||||
| UFCF | -11,328.2 | 8,665.8 | -7,422.3 | -11,930.9 | 12,775.1 | -8,045.0 | -2,459.2 | -2,921.1 | -3,469.7 | -4,121.4 |
| WACC, % | 4.84 | 4.83 | 4.83 | 4.83 | 4.83 | 4.83 | 4.83 | 4.83 | 4.83 | 4.83 |
| PV UFCF | ||||||||||
| SUM PV UFCF | -18,574.7 | |||||||||
| Long Term Growth Rate, % | 4.00 | |||||||||
| Free cash flow (T + 1) | -4,286 | |||||||||
| Terminal Value | -514,016 | |||||||||
| Present Terminal Value | -405,946 | |||||||||
| Enterprise Value | -424,521 | |||||||||
| Net Debt | -25,522 | |||||||||
| Equity Value | -398,998 | |||||||||
| Diluted Shares Outstanding, MM | 263 | |||||||||
| Equity Value Per Share | -1,516.75 |
What You'll Receive
- Customizable Excel Template: An editable Excel-based DCF Calculator featuring pre-filled financial data for Cochin Shipyard Limited (COCHINSHIPNS).
- Genuine Data: Access to historical data and forward-looking estimates (highlighted in the yellow cells).
- Flexible Forecasting: Adjust key assumptions such as revenue growth, EBITDA %, and WACC with ease.
- Instantaneous Calculations: Quickly assess how your inputs affect the valuation of Cochin Shipyard Limited (COCHINSHIPNS).
- Professional-grade Tool: Designed for investors, CFOs, consultants, and financial analysts.
- User-Centric Layout: Organized for transparency and simplicity, complete with step-by-step guidance.
Key Features
- Comprehensive DCF Calculator: Offers detailed unlevered and levered DCF valuation models tailored for Cochin Shipyard Limited (COCHINSHIPNS).
- WACC Calculator: Pre-configured Weighted Average Cost of Capital sheet with adjustable input options.
- Customizable Forecast Assumptions: Easily adjust growth rates, capital expenditures, and discount rates specific to Cochin Shipyard Limited (COCHINSHIPNS).
- Integrated Financial Ratios: Evaluate profitability, leverage, and efficiency ratios relevant to Cochin Shipyard Limited (COCHINSHIPNS).
- Interactive Dashboard and Charts: Visual representations that distill key valuation metrics for straightforward analysis.
How It Works
- 1. Access the Template: Download and open the Excel file featuring Cochin Shipyard Limited’s (COCHINSHIPNS) preloaded data.
- 2. Modify Assumptions: Update essential inputs such as growth projections, WACC, and capital expenditure figures.
- 3. Observe Instant Results: The DCF model automatically computes the intrinsic value and NPV for you.
- 4. Experiment with Scenarios: Evaluate various forecasts to examine different valuation possibilities.
- 5. Utilize with Assurance: Share professional valuation insights to enhance your decision-making process.
Why Opt for Cochin Shipyard Limited (COCHINSHIPNS)?
- Streamlined Process: Skip the hassle of building a valuation model from scratch – it's ready for you!
- Enhanced Precision: Trustworthy financial metrics and formulas minimize valuation errors.
- Completely Adaptable: Customize the model to align with your specific forecasts and assumptions.
- User-Friendly Insights: Intuitive charts and outputs simplify result analysis.
- Endorsed by Industry Leaders: Crafted for professionals who prioritize accuracy and practicality.
Who Should Utilize This Product?
- Investors: Evaluate Cochin Shipyard Limited’s (COCHINSHIPNS) valuation before making stock transactions.
- CFOs and Financial Analysts: Enhance valuation workflows and assess financial projections.
- Startup Founders: Discover how large public entities like Cochin Shipyard Limited are appraised.
- Consultants: Provide comprehensive valuation reports to clients regarding Cochin Shipyard Limited.
- Students and Educators: Utilize authentic data to practice and teach valuation methodologies.
Contents of the Template
- Pre-Filled Data: Comprises Cochin Shipyard Limited's historical financials and projections.
- Discounted Cash Flow Model: An editable DCF valuation model featuring automatic calculations.
- Weighted Average Cost of Capital (WACC): A separate sheet for calculating WACC based on user-defined inputs.
- Key Financial Ratios: Evaluate the profitability, efficiency, and leverage of Cochin Shipyard Limited.
- Customizable Inputs: Easily modify revenue growth, margins, and tax rates.
- Clear Dashboard: Visuals and tables summarizing essential valuation outcomes.
Disclaimer
All information, articles, and product details provided on this website are for general informational and educational purposes only. We do not claim any ownership over, nor do we intend to infringe upon, any trademarks, copyrights, logos, brand names, or other intellectual property mentioned or depicted on this site. Such intellectual property remains the property of its respective owners, and any references here are made solely for identification or informational purposes, without implying any affiliation, endorsement, or partnership.
We make no representations or warranties, express or implied, regarding the accuracy, completeness, or suitability of any content or products presented. Nothing on this website should be construed as legal, tax, investment, financial, medical, or other professional advice. In addition, no part of this site—including articles or product references—constitutes a solicitation, recommendation, endorsement, advertisement, or offer to buy or sell any securities, franchises, or other financial instruments, particularly in jurisdictions where such activity would be unlawful.
All content is of a general nature and may not address the specific circumstances of any individual or entity. It is not a substitute for professional advice or services. Any actions you take based on the information provided here are strictly at your own risk. You accept full responsibility for any decisions or outcomes arising from your use of this website and agree to release us from any liability in connection with your use of, or reliance upon, the content or products found herein.