
|
Columbia Sportswear Company (COLM) DCF Valation |
Entièrement Modifiable: Adapté À Vos Besoins Dans Excel Ou Sheets
Conception Professionnelle: Modèles Fiables Et Conformes Aux Normes Du Secteur
Pré-Construits Pour Une Utilisation Rapide Et Efficace
Compatible MAC/PC, entièrement débloqué
Aucune Expertise N'Est Requise; Facile À Suivre
Columbia Sportswear Company (COLM) Bundle
Conçu pour la précision, notre calculatrice (COLM) DCF vous permet d'évaluer l'évaluation de Columbia Sportswear Company en utilisant des données financières réelles, offrant une flexibilité complète pour modifier tous les paramètres essentiels pour des projections améliorées.
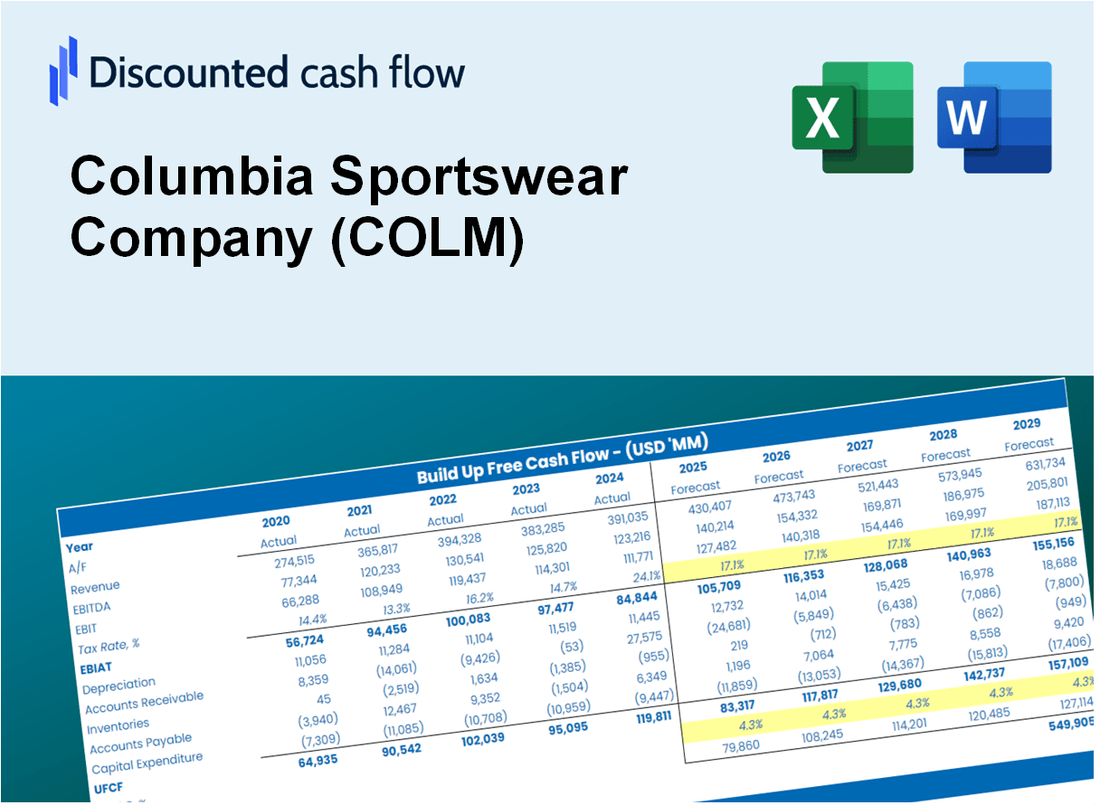
Discounted Cash Flow (DCF) - (USD MM)
| Year | AY1 2020 |
AY2 2021 |
AY3 2022 |
AY4 2023 |
AY5 2024 |
FY1 2025 |
FY2 2026 |
FY3 2027 |
FY4 2028 |
FY5 2029 |
|---|---|---|---|---|---|---|---|---|---|---|
| Revenue | 2,501.6 | 3,126.4 | 3,464.2 | 3,487.2 | 3,368.6 | 3,646.9 | 3,948.2 | 4,274.3 | 4,627.4 | 5,009.7 |
| Revenue Growth, % | 0 | 24.98 | 10.8 | 0.66542 | -3.4 | 8.26 | 8.26 | 8.26 | 8.26 | 8.26 |
| EBITDA | 286.1 | 566.1 | 546.9 | 393.3 | 326.7 | 483.6 | 523.6 | 566.9 | 613.7 | 664.4 |
| EBITDA, % | 11.44 | 18.11 | 15.79 | 11.28 | 9.7 | 13.26 | 13.26 | 13.26 | 13.26 | 13.26 |
| Depreciation | 146.6 | 115.6 | 117.4 | 58.1 | 55.9 | 118.7 | 128.5 | 139.1 | 150.6 | 163.0 |
| Depreciation, % | 5.86 | 3.7 | 3.39 | 1.67 | 1.66 | 3.25 | 3.25 | 3.25 | 3.25 | 3.25 |
| EBIT | 139.5 | 450.5 | 429.5 | 335.3 | 270.7 | 365.0 | 395.1 | 427.8 | 463.1 | 501.3 |
| EBIT, % | 5.58 | 14.41 | 12.4 | 9.61 | 8.04 | 10.01 | 10.01 | 10.01 | 10.01 | 10.01 |
| Total Cash | 791.9 | 894.5 | 431.0 | 764.5 | 815.5 | 866.8 | 938.4 | 1,015.9 | 1,099.9 | 1,190.7 |
| Total Cash, percent | .0 | .0 | .0 | .0 | .0 | .0 | .0 | .0 | .0 | .0 |
| Account Receivables | 452.9 | 487.8 | 547.6 | 423.1 | 417.5 | 540.1 | 584.7 | 633.0 | 685.3 | 741.9 |
| Account Receivables, % | 18.11 | 15.6 | 15.81 | 12.13 | 12.4 | 14.81 | 14.81 | 14.81 | 14.81 | 14.81 |
| Inventories | 556.5 | 645.4 | 1,028.5 | 746.3 | 690.5 | 835.0 | 904.0 | 978.7 | 1,059.5 | 1,147.0 |
| Inventories, % | 22.25 | 20.64 | 29.69 | 21.4 | 20.5 | 22.9 | 22.9 | 22.9 | 22.9 | 22.9 |
| Accounts Payable | 206.7 | 283.3 | 322.5 | 235.9 | 385.7 | 327.1 | 354.1 | 383.4 | 415.1 | 449.4 |
| Accounts Payable, % | 8.26 | 9.06 | 9.31 | 6.77 | 11.45 | 8.97 | 8.97 | 8.97 | 8.97 | 8.97 |
| Capital Expenditure | -28.8 | -34.7 | -58.5 | -54.6 | -59.8 | -53.2 | -57.6 | -62.3 | -67.5 | -73.0 |
| Capital Expenditure, % | -1.15 | -1.11 | -1.69 | -1.57 | -1.78 | -1.46 | -1.46 | -1.46 | -1.46 | -1.46 |
| Tax Rate, % | 25.12 | 25.12 | 25.12 | 25.12 | 25.12 | 25.12 | 25.12 | 25.12 | 25.12 | 25.12 |
| EBITAT | 108.0 | 353.3 | 336.6 | 258.4 | 202.7 | 281.9 | 305.2 | 330.4 | 357.7 | 387.2 |
| Depreciation | ||||||||||
| Changes in Account Receivables | ||||||||||
| Changes in Inventories | ||||||||||
| Changes in Accounts Payable | ||||||||||
| Capital Expenditure | ||||||||||
| UFCF | -576.9 | 387.1 | -8.3 | 582.1 | 409.9 | 21.8 | 289.5 | 313.4 | 339.3 | 367.3 |
| WACC, % | 7.57 | 7.57 | 7.57 | 7.57 | 7.55 | 7.57 | 7.57 | 7.57 | 7.57 | 7.57 |
| PV UFCF | ||||||||||
| SUM PV UFCF | 1,030.9 | |||||||||
| Long Term Growth Rate, % | 3.00 | |||||||||
| Free cash flow (T + 1) | 378 | |||||||||
| Terminal Value | 8,287 | |||||||||
| Present Terminal Value | 5,755 | |||||||||
| Enterprise Value | 6,785 | |||||||||
| Net Debt | -83 | |||||||||
| Equity Value | 6,868 | |||||||||
| Diluted Shares Outstanding, MM | 59 | |||||||||
| Equity Value Per Share | 117.40 |
What You Will Receive
- Customizable Excel Template: A fully adjustable Excel-based DCF Calculator featuring pre-filled real COLM financials.
- Authentic Data: Historical figures and projected estimates (highlighted in the yellow cells).
- Assumption Flexibility: Modify forecast parameters such as revenue growth, EBITDA %, and WACC.
- Instant Calculations: Quickly observe how your inputs affect Columbia Sportswear's valuation.
- Professional Resource: Designed for investors, CFOs, consultants, and financial analysts.
- User-Friendly Layout: Organized for clarity and ease of navigation, complete with step-by-step guidance.
Key Features
- Customizable Performance Metrics: Adjust essential inputs such as sales growth, gross margin %, and operating expenses.
- Instant DCF Valuation: Quickly computes intrinsic value, net present value (NPV), and other financial metrics.
- High-Precision Accuracy: Leverages Columbia Sportswear's actual financial data for credible valuation results.
- Effortless Scenario Analysis: Evaluate various assumptions and analyze results with ease.
- Efficiency Booster: Remove the hassle of constructing intricate valuation models from the ground up.
How It Works
- Step 1: Download the Excel file.
- Step 2: Review pre-entered Columbia Sportswear Company (COLM) data (historical and projected).
- Step 3: Adjust key assumptions (yellow cells) based on your analysis.
- Step 4: View automatic recalculations for Columbia Sportswear Company’s intrinsic value.
- Step 5: Use the outputs for investment decisions or reporting.
Why Choose This Calculator for Columbia Sportswear Company (COLM)?
- Accurate Data: Utilize real Columbia Sportswear financials for trustworthy valuation outcomes.
- Customizable: Tailor essential parameters such as growth rates, WACC, and tax rates to fit your forecasts.
- Time-Saving: Pre-configured calculations save you the hassle of building from the ground up.
- Professional-Grade Tool: Crafted for investors, analysts, and consultants focused on Columbia Sportswear.
- User-Friendly: Simple design and guided instructions ensure ease of use for everyone.
Who Should Use This Product?
- Outdoor Enthusiasts: Discover how to evaluate gear performance and durability using real-world data.
- Students in Fashion and Design: Integrate industry-leading apparel models into your projects and presentations.
- Investors: Validate your investment strategies and assess valuation metrics for Columbia Sportswear (COLM).
- Market Analysts: Enhance your analysis with a ready-to-use, customizable financial model specific to outdoor apparel.
- Retail Business Owners: Learn from the strategies used by successful companies like Columbia Sportswear (COLM).
What the Template Contains
- Pre-Filled DCF Model: Columbia Sportswear Company’s financial data preloaded for immediate use.
- WACC Calculator: Detailed calculations for Weighted Average Cost of Capital.
- Financial Ratios: Evaluate Columbia Sportswear Company’s profitability, leverage, and efficiency.
- Editable Inputs: Change assumptions such as growth, margins, and CAPEX to fit your scenarios.
- Financial Statements: Annual and quarterly reports to support detailed analysis.
- Interactive Dashboard: Easily visualize key valuation metrics and results.
Disclaimer
All information, articles, and product details provided on this website are for general informational and educational purposes only. We do not claim any ownership over, nor do we intend to infringe upon, any trademarks, copyrights, logos, brand names, or other intellectual property mentioned or depicted on this site. Such intellectual property remains the property of its respective owners, and any references here are made solely for identification or informational purposes, without implying any affiliation, endorsement, or partnership.
We make no representations or warranties, express or implied, regarding the accuracy, completeness, or suitability of any content or products presented. Nothing on this website should be construed as legal, tax, investment, financial, medical, or other professional advice. In addition, no part of this site—including articles or product references—constitutes a solicitation, recommendation, endorsement, advertisement, or offer to buy or sell any securities, franchises, or other financial instruments, particularly in jurisdictions where such activity would be unlawful.
All content is of a general nature and may not address the specific circumstances of any individual or entity. It is not a substitute for professional advice or services. Any actions you take based on the information provided here are strictly at your own risk. You accept full responsibility for any decisions or outcomes arising from your use of this website and agree to release us from any liability in connection with your use of, or reliance upon, the content or products found herein.