
|
Dabur India Limited (Dabur.NS) Évaluation DCF |
Entièrement Modifiable: Adapté À Vos Besoins Dans Excel Ou Sheets
Conception Professionnelle: Modèles Fiables Et Conformes Aux Normes Du Secteur
Pré-Construits Pour Une Utilisation Rapide Et Efficace
Compatible MAC/PC, entièrement débloqué
Aucune Expertise N'Est Requise; Facile À Suivre
Dabur India Limited (DABUR.NS) Bundle
Découvrez le véritable potentiel de Dabur India Limited (Daburns) avec notre calculatrice avancée DCF! Ajustez les hypothèses essentielles, explorez divers scénarios et évaluez comment les modifications affectent l'évaluation Dabur India Limited (Daburns) - le tout dans un modèle d'excel complet.
Discounted Cash Flow (DCF) - (USD MM)
| Year | AY1 2021 |
AY2 2022 |
AY3 2023 |
AY4 2024 |
AY5 2025 |
FY1 2026 |
FY2 2027 |
FY3 2028 |
FY4 2029 |
FY5 2030 |
|---|---|---|---|---|---|---|---|---|---|---|
| Revenue | 95,616.5 | 108,886.8 | 115,298.9 | 124,040.1 | 125,630.9 | 134,623.3 | 144,259.4 | 154,585.3 | 165,650.2 | 177,507.1 |
| Revenue Growth, % | 0 | 13.88 | 5.89 | 7.58 | 1.28 | 7.16 | 7.16 | 7.16 | 7.16 | 7.16 |
| EBITDA | 19,782.6 | 22,249.7 | 21,466.7 | 23,832.3 | 22,855.3 | 26,156.6 | 28,028.9 | 30,035.1 | 32,185.0 | 34,488.7 |
| EBITDA, % | 20.69 | 20.43 | 18.62 | 19.21 | 18.19 | 19.43 | 19.43 | 19.43 | 19.43 | 19.43 |
| Depreciation | 2,005.3 | 2,103.6 | 2,677.6 | 3,522.2 | 3,914.7 | 3,313.6 | 3,550.8 | 3,805.0 | 4,077.3 | 4,369.2 |
| Depreciation, % | 2.1 | 1.93 | 2.32 | 2.84 | 3.12 | 2.46 | 2.46 | 2.46 | 2.46 | 2.46 |
| EBIT | 17,777.3 | 20,146.1 | 18,789.1 | 20,310.1 | 18,940.6 | 22,843.0 | 24,478.0 | 26,230.1 | 28,107.6 | 30,119.5 |
| EBIT, % | 18.59 | 18.5 | 16.3 | 16.37 | 15.08 | 16.97 | 16.97 | 16.97 | 16.97 | 16.97 |
| Total Cash | 20,074.8 | 14,022.3 | 10,913.6 | 23,231.1 | 26,556.4 | 22,402.8 | 24,006.4 | 25,724.7 | 27,566.0 | 29,539.2 |
| Total Cash, percent | .0 | .0 | .0 | .0 | .0 | .0 | .0 | .0 | .0 | .0 |
| Account Receivables | 6,218.0 | 6,461.5 | 9,406.9 | 10,459.7 | 8,885.0 | 9,720.0 | 10,415.7 | 11,161.3 | 11,960.2 | 12,816.3 |
| Account Receivables, % | 6.5 | 5.93 | 8.16 | 8.43 | 7.07 | 7.22 | 7.22 | 7.22 | 7.22 | 7.22 |
| Inventories | 17,342.8 | 19,113.7 | 20,242.0 | 19,469.7 | 23,001.1 | 23,492.4 | 25,174.0 | 26,975.9 | 28,906.8 | 30,975.9 |
| Inventories, % | 18.14 | 17.55 | 17.56 | 15.7 | 18.31 | 17.45 | 17.45 | 17.45 | 17.45 | 17.45 |
| Accounts Payable | 19,152.6 | 20,179.5 | 21,866.1 | 24,217.1 | 28,253.4 | 26,801.0 | 28,719.4 | 30,775.1 | 32,977.9 | 35,338.4 |
| Accounts Payable, % | 20.03 | 18.53 | 18.96 | 19.52 | 22.49 | 19.91 | 19.91 | 19.91 | 19.91 | 19.91 |
| Capital Expenditure | -3,112.1 | -3,741.3 | -5,090.9 | -5,638.6 | -5,695.4 | -5,434.8 | -5,823.9 | -6,240.7 | -6,687.4 | -7,166.1 |
| Capital Expenditure, % | -3.25 | -3.44 | -4.42 | -4.55 | -4.53 | -4.04 | -4.04 | -4.04 | -4.04 | -4.04 |
| Tax Rate, % | 21.71 | 21.71 | 21.71 | 21.71 | 21.71 | 21.71 | 21.71 | 21.71 | 21.71 | 21.71 |
| EBITAT | 14,641.1 | 15,444.4 | 14,457.2 | 15,866.5 | 14,828.0 | 17,925.9 | 19,209.0 | 20,584.0 | 22,057.4 | 23,636.2 |
| Depreciation | ||||||||||
| Changes in Account Receivables | ||||||||||
| Changes in Inventories | ||||||||||
| Changes in Accounts Payable | ||||||||||
| Capital Expenditure | ||||||||||
| UFCF | 9,126.1 | 12,819.2 | 9,656.8 | 15,820.6 | 15,126.9 | 13,026.0 | 16,477.1 | 17,656.5 | 18,920.3 | 20,274.6 |
| WACC, % | 5 | 4.99 | 4.99 | 4.99 | 4.99 | 4.99 | 4.99 | 4.99 | 4.99 | 4.99 |
| PV UFCF | ||||||||||
| SUM PV UFCF | 74,070.7 | |||||||||
| Long Term Growth Rate, % | 4.00 | |||||||||
| Free cash flow (T + 1) | 21,086 | |||||||||
| Terminal Value | 2,124,082 | |||||||||
| Present Terminal Value | 1,664,853 | |||||||||
| Enterprise Value | 1,738,924 | |||||||||
| Net Debt | 7,661 | |||||||||
| Equity Value | 1,731,263 | |||||||||
| Diluted Shares Outstanding, MM | 1,776 | |||||||||
| Equity Value Per Share | 974.90 |
What You'll Receive
- Customizable Excel Template: A fully adjustable Excel-based DCF Calculator featuring pre-populated financial data for Dabur India Limited (DABURNS).
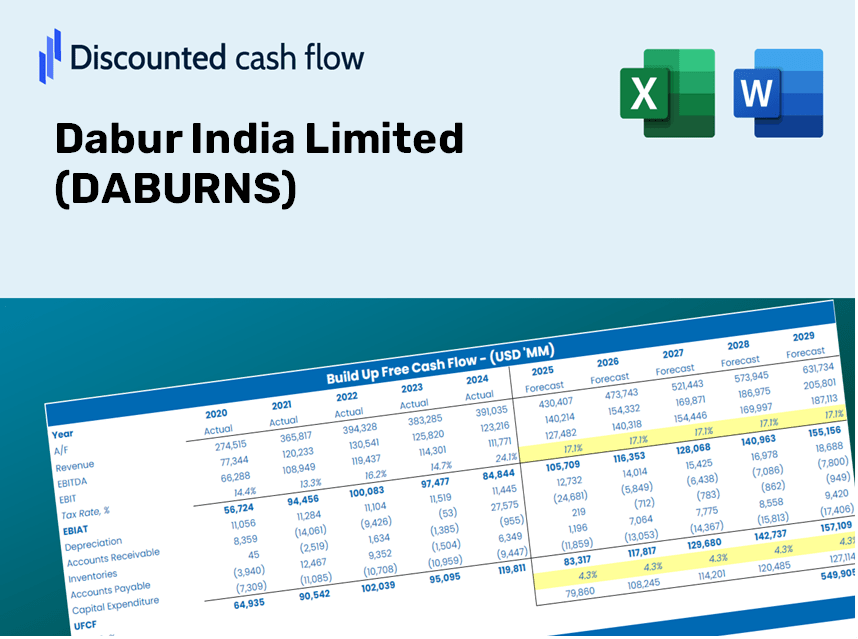
- Genuine Data: Historical performance metrics and future projections (highlighted in the yellow cells).
- Flexible Forecasting: Modify forecast parameters such as revenue growth, EBITDA %, and WACC.
- Instant Calculations: Quickly observe how your inputs influence Dabur India's valuation.
- Professional Resource: Designed for investors, CFOs, consultants, and financial analysts.
- User-Friendly Interface: Organized for clarity and simplicity, complete with step-by-step guidance.
Key Features
- Authentic Dabur Financials: Gain access to precise pre-loaded historical data and future forecasts.
- Adjustable Forecast Parameters: Modify the yellow-highlighted fields such as WACC, growth rates, and profit margins.
- Real-time Calculations: Automatic updates for DCF, Net Present Value (NPV), and cash flow analyses.
- Interactive Dashboard: Clear, user-friendly charts and summaries to help you visualize valuation outcomes.
- Designed for All Skill Levels: A straightforward and intuitive layout tailored for investors, CFOs, and consultants alike.
How It Operates
- Download the Template: Get immediate access to the Excel-based DABURNS DCF Calculator.
- Enter Your Assumptions: Modify the yellow-highlighted cells for growth rates, WACC, margins, and additional variables.
- Instant Results: The model automatically calculates Dabur India Limited’s intrinsic value.
- Explore Scenarios: Test various assumptions to assess potential changes in valuation.
- Evaluate and Decide: Leverage the results to inform your investment or financial analysis.
Why Opt for This Calculator?
- Precise Data: Authentic Dabur India Limited financials deliver trustworthy valuation outcomes.
- Fully Customizable: Modify crucial variables such as growth projections, WACC, and tax rates to align with your forecasts.
- Efficient: Ready-made computations save you the hassle of starting from the ground up.
- Professional Quality: Tailored for investors, analysts, and consultants in the field.
- Easy to Use: User-friendly design and clear guidance make it accessible for everyone.
Who Should Utilize This Product?
- Investors: Precisely assess Dabur India Limited's (DABURNS) intrinsic value prior to making investment choices.
- CFOs: Utilize a high-quality DCF model for comprehensive financial analysis and reporting.
- Consultants: Effortlessly modify the template for client valuation reports.
- Entrepreneurs: Acquire knowledge about financial modeling techniques employed by leading corporations.
- Educators: Implement it as a resource for teaching valuation methods effectively.
Contents of the Template
- Operating and Balance Sheet Data: Pre-filled historical data and forecasts for Dabur India Limited (DABURNS), covering metrics such as revenue, EBITDA, EBIT, and capital expenditures.
- WACC Calculation: A dedicated section for calculating the Weighted Average Cost of Capital (WACC), incorporating variables such as Beta, risk-free rate, and share price.
- DCF Valuation (Unlevered and Levered): Customizable Discounted Cash Flow models that present intrinsic value along with comprehensive calculations.
- Financial Statements: Pre-loaded annual and quarterly financial statements designed to facilitate in-depth analysis.
- Key Ratios: A collection of profitability, leverage, and efficiency ratios specifically for Dabur India Limited (DABURNS).
- Dashboard and Charts: A visual representation of valuation results and underlying assumptions for straightforward analysis of outcomes.
Disclaimer
All information, articles, and product details provided on this website are for general informational and educational purposes only. We do not claim any ownership over, nor do we intend to infringe upon, any trademarks, copyrights, logos, brand names, or other intellectual property mentioned or depicted on this site. Such intellectual property remains the property of its respective owners, and any references here are made solely for identification or informational purposes, without implying any affiliation, endorsement, or partnership.
We make no representations or warranties, express or implied, regarding the accuracy, completeness, or suitability of any content or products presented. Nothing on this website should be construed as legal, tax, investment, financial, medical, or other professional advice. In addition, no part of this site—including articles or product references—constitutes a solicitation, recommendation, endorsement, advertisement, or offer to buy or sell any securities, franchises, or other financial instruments, particularly in jurisdictions where such activity would be unlawful.
All content is of a general nature and may not address the specific circumstances of any individual or entity. It is not a substitute for professional advice or services. Any actions you take based on the information provided here are strictly at your own risk. You accept full responsibility for any decisions or outcomes arising from your use of this website and agree to release us from any liability in connection with your use of, or reliance upon, the content or products found herein.