
|
Deutsche Bank Aktiengesellschaft (DB) Évaluation DCF |
Entièrement Modifiable: Adapté À Vos Besoins Dans Excel Ou Sheets
Conception Professionnelle: Modèles Fiables Et Conformes Aux Normes Du Secteur
Pré-Construits Pour Une Utilisation Rapide Et Efficace
Compatible MAC/PC, entièrement débloqué
Aucune Expertise N'Est Requise; Facile À Suivre
Deutsche Bank Aktiengesellschaft (DB) Bundle
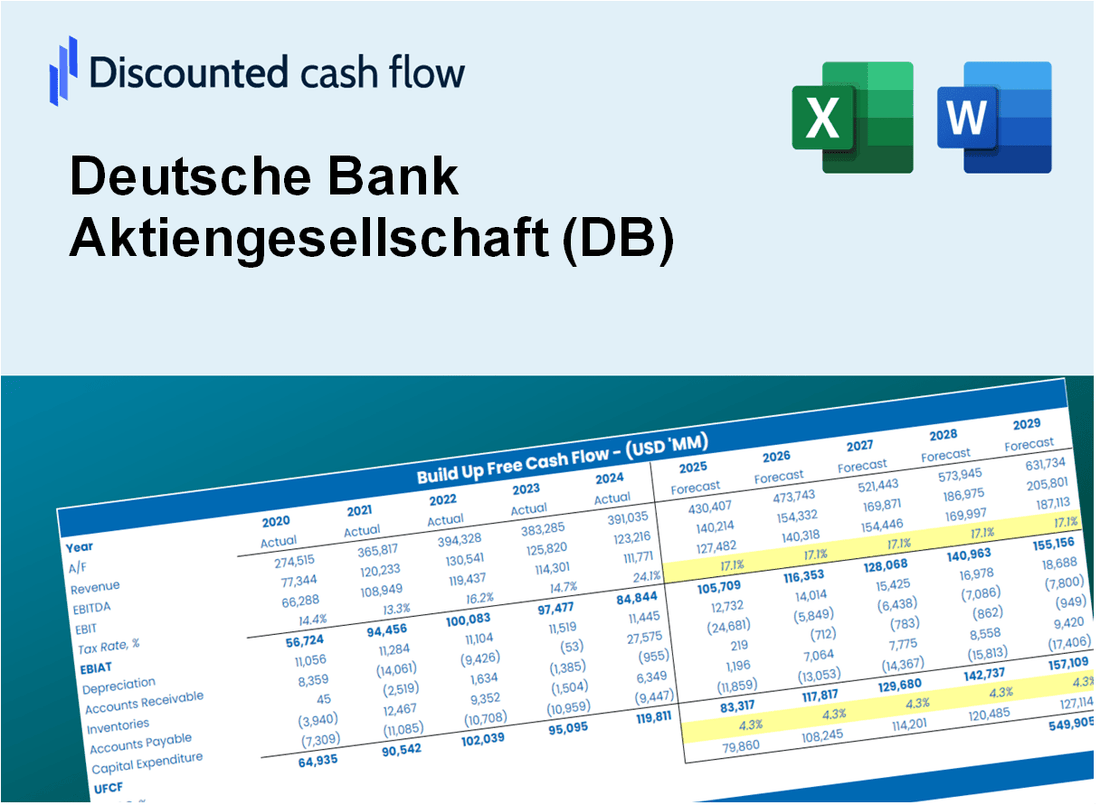
Rationalisez votre analyse et améliorez la précision avec notre calculatrice DCF (DB)! En utilisant des données bancaires de Deutsche réelles et des hypothèses personnalisables, cet outil vous permet de prévoir, d'analyser et d'évaluer la Deutsche Bank Aktiengegellschaft comme un investisseur chevronné.
What You Will Get
- Real DB Financials: Access to both historical and projected data for precise valuation.
- Customizable Inputs: Adjust WACC, tax rates, revenue growth, and capital expenditures as needed.
- Dynamic Calculations: Intrinsic value and NPV are computed automatically.
- Scenario Analysis: Evaluate various scenarios to assess Deutsche Bank’s future performance.
- User-Friendly Design: Designed for professionals while remaining easy to navigate for newcomers.
Key Features
- Pre-Loaded Data: Deutsche Bank’s historical financial statements and pre-filled forecasts.
- Fully Adjustable Inputs: Edit WACC, tax rates, revenue growth, and EBITDA margins.
- Instant Results: See Deutsche Bank’s intrinsic value recalculate in real time.
- Clear Visual Outputs: Dashboard charts display valuation results and key metrics.
- Built for Accuracy: A professional tool for analysts, investors, and finance experts.
How It Works
- Download the Template: Gain immediate access to the Excel-based DB DCF Calculator.
- Input Your Assumptions: Modify the yellow-highlighted cells for growth rates, WACC, margins, and additional parameters.
- Instant Calculations: The model automatically recalculates Deutsche Bank's intrinsic value.
- Test Scenarios: Experiment with various assumptions to assess potential changes in valuation.
- Analyze and Decide: Utilize the results to inform your investment or financial analysis decisions.
Why Choose This Calculator for Deutsche Bank Aktiengesellschaft (DB)?
- All-in-One Solution: Features DCF, WACC, and financial ratio analyses seamlessly integrated.
- Flexible Inputs: Modify yellow-highlighted fields to explore different financial scenarios.
- In-Depth Analysis: Automatically computes Deutsche Bank’s intrinsic value and Net Present Value.
- Preloaded Information: Utilizes historical and projected data for reliable baseline calculations.
- High-Quality Standards: Perfect for financial analysts, investors, and business advisors.
Who Should Use This Product?
- Institutional Investors: Develop comprehensive and precise valuation models for investment strategies involving Deutsche Bank Aktiengesellschaft (DB).
- Corporate Finance Departments: Evaluate valuation scenarios to inform corporate decision-making and strategic planning.
- Financial Consultants: Deliver accurate valuation assessments and insights for clients interested in Deutsche Bank Aktiengesellschaft (DB).
- Academics and Students: Utilize real-time financial data to enhance learning and practice in financial modeling.
- Finance Enthusiasts: Gain insights into how major banking institutions like Deutsche Bank Aktiengesellschaft (DB) are valued within the financial market.
What the Template Contains
- Historical Data: Includes Deutsche Bank’s past financials and baseline forecasts.
- DCF and Levered DCF Models: Detailed templates to calculate Deutsche Bank’s intrinsic value.
- WACC Sheet: Pre-built calculations for Weighted Average Cost of Capital.
- Editable Inputs: Modify key drivers like growth rates, EBITDA %, and CAPEX assumptions.
- Quarterly and Annual Statements: A complete breakdown of Deutsche Bank’s financials.
- Interactive Dashboard: Visualize valuation results and projections dynamically.
Disclaimer
All information, articles, and product details provided on this website are for general informational and educational purposes only. We do not claim any ownership over, nor do we intend to infringe upon, any trademarks, copyrights, logos, brand names, or other intellectual property mentioned or depicted on this site. Such intellectual property remains the property of its respective owners, and any references here are made solely for identification or informational purposes, without implying any affiliation, endorsement, or partnership.
We make no representations or warranties, express or implied, regarding the accuracy, completeness, or suitability of any content or products presented. Nothing on this website should be construed as legal, tax, investment, financial, medical, or other professional advice. In addition, no part of this site—including articles or product references—constitutes a solicitation, recommendation, endorsement, advertisement, or offer to buy or sell any securities, franchises, or other financial instruments, particularly in jurisdictions where such activity would be unlawful.
All content is of a general nature and may not address the specific circumstances of any individual or entity. It is not a substitute for professional advice or services. Any actions you take based on the information provided here are strictly at your own risk. You accept full responsibility for any decisions or outcomes arising from your use of this website and agree to release us from any liability in connection with your use of, or reliance upon, the content or products found herein.