
|
Avenue SuperMarts Limited (DMART.NS) Valeure DCF |
Entièrement Modifiable: Adapté À Vos Besoins Dans Excel Ou Sheets
Conception Professionnelle: Modèles Fiables Et Conformes Aux Normes Du Secteur
Pré-Construits Pour Une Utilisation Rapide Et Efficace
Compatible MAC/PC, entièrement débloqué
Aucune Expertise N'Est Requise; Facile À Suivre
Avenue Supermarts Limited (DMART.NS) Bundle
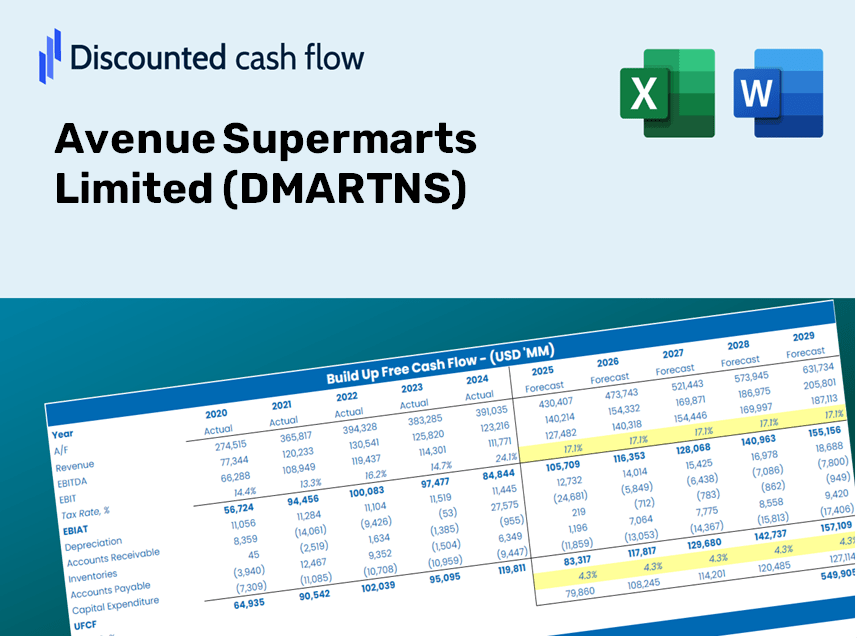
Gagnez la maîtrise sur l'analyse de l'évaluation de votre avenue SuperMarts Limited (DMARTNS) à l'aide de notre calculatrice DCF de pointe! Ce modèle Excel est préchargé avec des données réelles (DMARTN), vous permettant d'ajuster les prévisions et les hypothèses pour un calcul précis de la valeur intrinsèque d'Avenue SuperMarts Limited.
What You Will Receive
- Genuine Avenue Supermarts Data: Preloaded financials – covering everything from revenue to EBIT – based on actual and projected figures.
- Comprehensive Customization: Modify all essential parameters (yellow cells) such as WACC, growth %, and tax rates.
- Real-Time Valuation Adjustments: Automatic recalculations to evaluate the effects of changes on Avenue Supermarts' fair value.
- Flexible Excel Template: Designed for easy edits, scenario modeling, and in-depth projections.
- Efficient and Precise: Eliminate the need to build models from the ground up while ensuring accuracy and adaptability.
Key Features
- Customizable Financial Inputs: Adjust vital parameters such as sales growth, profit margins, and investment expenditures.
- Instant DCF Valuation: Automatically computes intrinsic value, net present value, and other critical metrics.
- High-Precision Accuracy: Leverages Avenue Supermarts Limited’s (DMARTNS) real-world financial data for realistic valuation results.
- Effortless Scenario Analysis: Easily evaluate diverse assumptions and analyze varying outcomes.
- Efficiency Booster: Avoid the hassle of constructing intricate valuation models from the ground up.
How It Works
- Download the Template: Gain immediate access to the Excel-based DMARTNS DCF Calculator.
- Input Your Assumptions: Modify the yellow-highlighted cells to set your growth rates, WACC, margins, and other variables.
- Instant Calculations: The model automatically recalculates Avenue Supermarts Limited’s intrinsic value.
- Test Scenarios: Experiment with various assumptions to assess potential valuation outcomes.
- Analyze and Decide: Leverage the results to inform your investment strategy or financial analysis.
Why Choose Avenue Supermarts Limited (DMARTNS)?
- Save Time: Skip the hassle of starting from scratch – our solutions are ready for immediate use.
- Enhance Accuracy: Dependable financial data and robust formulas minimize valuation errors.
- Completely Customizable: Adjust the model to align with your specific assumptions and forecasts.
- Easy to Understand: Intuitive charts and outputs simplify result interpretation.
- Endorsed by Professionals: Crafted for those who prioritize precision and ease of use.
Who Should Utilize This Product?
- Investors: Accurately assess the fair value of Avenue Supermarts Limited (DMARTNS) before making investment choices.
- CFOs: Utilize a professional-grade DCF model for comprehensive financial reporting and analysis.
- Consultants: Easily customize the template for client valuation reports.
- Entrepreneurs: Discover insights into financial modeling techniques employed by industry leaders.
- Educators: Employ it as a valuable teaching resource for illustrating valuation methods.
What the Template Includes
- Historical Data: Contains Avenue Supermarts Limited’s past financial performance and baseline forecasts.
- DCF and Levered DCF Models: Comprehensive templates for calculating the intrinsic value of Avenue Supermarts Limited (DMARTNS).
- WACC Sheet: Pre-calculated metrics for the Weighted Average Cost of Capital.
- Editable Inputs: Customize essential variables such as growth rates, EBITDA %, and capital expenditure assumptions.
- Quarterly and Annual Statements: An extensive analysis of Avenue Supermarts Limited’s financial reports.
- Interactive Dashboard: A dynamic interface to visualize valuation outcomes and forecasts.
Disclaimer
All information, articles, and product details provided on this website are for general informational and educational purposes only. We do not claim any ownership over, nor do we intend to infringe upon, any trademarks, copyrights, logos, brand names, or other intellectual property mentioned or depicted on this site. Such intellectual property remains the property of its respective owners, and any references here are made solely for identification or informational purposes, without implying any affiliation, endorsement, or partnership.
We make no representations or warranties, express or implied, regarding the accuracy, completeness, or suitability of any content or products presented. Nothing on this website should be construed as legal, tax, investment, financial, medical, or other professional advice. In addition, no part of this site—including articles or product references—constitutes a solicitation, recommendation, endorsement, advertisement, or offer to buy or sell any securities, franchises, or other financial instruments, particularly in jurisdictions where such activity would be unlawful.
All content is of a general nature and may not address the specific circumstances of any individual or entity. It is not a substitute for professional advice or services. Any actions you take based on the information provided here are strictly at your own risk. You accept full responsibility for any decisions or outcomes arising from your use of this website and agree to release us from any liability in connection with your use of, or reliance upon, the content or products found herein.