
|
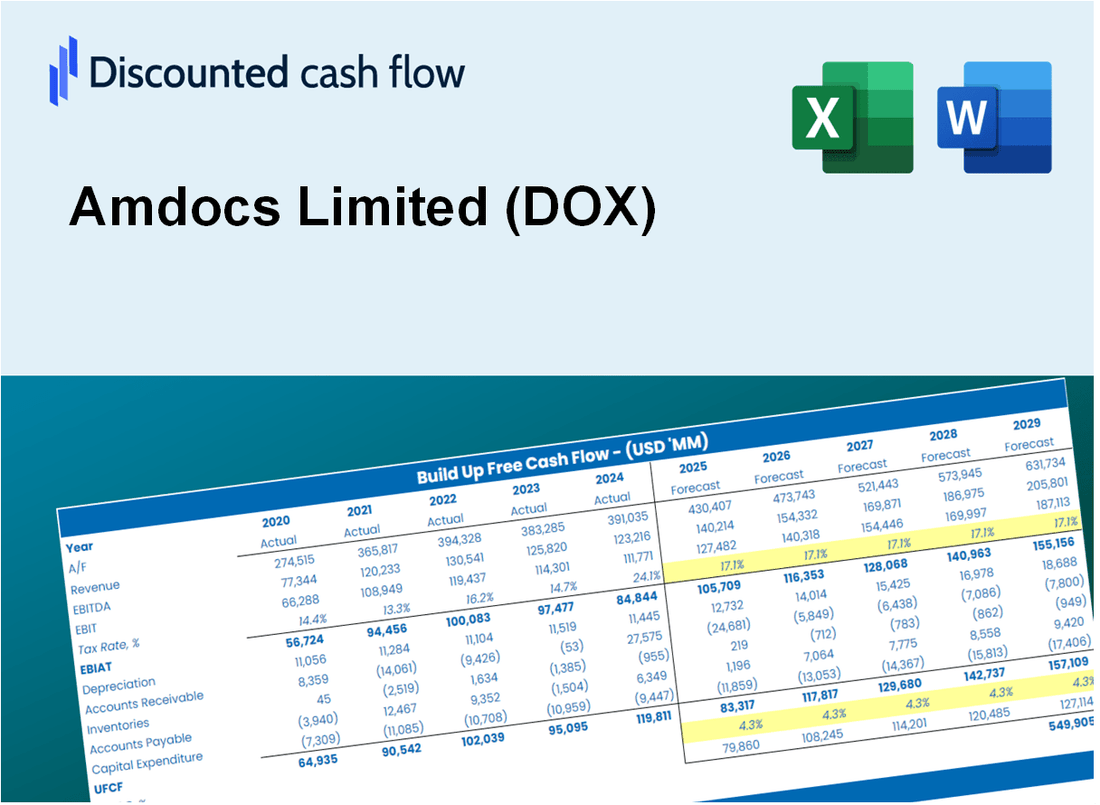
AMDOCS Limited (DOX) Évaluation DCF |
Entièrement Modifiable: Adapté À Vos Besoins Dans Excel Ou Sheets
Conception Professionnelle: Modèles Fiables Et Conformes Aux Normes Du Secteur
Pré-Construits Pour Une Utilisation Rapide Et Efficace
Compatible MAC/PC, entièrement débloqué
Aucune Expertise N'Est Requise; Facile À Suivre
Amdocs Limited (DOX) Bundle
Vous cherchez à déterminer la valeur intrinsèque d'AMDOCS Limited (DOX)? Notre calculatrice (DOX) DCF intègre des données réelles avec des fonctionnalités de personnalisation complètes, vous permettant d'affiner vos prévisions et d'améliorer vos choix d'investissement.
What You Will Get
- Editable Forecast Inputs: Effortlessly modify key assumptions (growth %, margins, WACC) to explore various scenarios.
- Real-World Data: Amdocs Limited’s (DOX) financial data pre-loaded to facilitate your analysis.
- Automatic DCF Outputs: The template computes Net Present Value (NPV) and intrinsic value automatically.
- Customizable and Professional: A refined Excel model that adjusts to meet your valuation requirements.
- Built for Analysts and Investors: Perfect for evaluating projections, confirming strategies, and enhancing efficiency.
Key Features
- Comprehensive Amdocs Data: Includes Amdocs Limited's historical financial performance and future projections.
- Flexible Input Options: Modify revenue growth, profit margins, WACC, tax rates, and capital expenditures as needed.
- Responsive Valuation Model: Automatically recalculates Net Present Value (NPV) and intrinsic value based on your customized inputs.
- Scenario Analysis: Develop various forecasting scenarios to evaluate different valuation results.
- Intuitive Interface: Designed to be straightforward and accessible for both seasoned professionals and newcomers.
How It Works
- Step 1: Download the prebuilt Excel template with Amdocs Limited’s (DOX) data included.
- Step 2: Explore the pre-filled sheets and familiarize yourself with the key metrics.
- Step 3: Update forecasts and assumptions in the editable yellow cells (WACC, growth, margins).
- Step 4: Instantly view recalculated results, including Amdocs Limited’s (DOX) intrinsic value.
- Step 5: Make informed investment decisions or generate reports using the outputs.
Why Choose This Calculator for Amdocs Limited (DOX)?
- User-Friendly Interface: Perfectly crafted for both novices and seasoned users.
- Customizable Inputs: Easily adjust parameters to suit your financial analysis.
- Real-Time Feedback: Observe immediate changes to Amdocs’ valuation as you tweak inputs.
- Preloaded Data: Comes with Amdocs’ actual financial metrics for swift evaluations.
- Relied Upon by Experts: Utilized by investors and analysts for making well-informed choices.
Who Should Use Amdocs Limited (DOX)?
- Telecommunications Professionals: Leverage Amdocs' solutions to enhance customer experience and operational efficiency.
- IT Managers: Streamline processes with Amdocs' advanced software and services tailored for the industry.
- Business Analysts: Utilize data-driven insights from Amdocs to inform strategic decision-making.
- Investors: Assess growth potential and market position with Amdocs' robust financial performance metrics.
- Students and Educators: Explore case studies and resources related to digital transformation in telecommunications.
What the Template Contains
- Historical Data: Includes Amdocs Limited’s past financials and baseline forecasts.
- DCF and Levered DCF Models: Detailed templates to calculate Amdocs Limited’s intrinsic value.
- WACC Sheet: Pre-built calculations for Weighted Average Cost of Capital.
- Editable Inputs: Modify key drivers like growth rates, EBITDA %, and CAPEX assumptions.
- Quarterly and Annual Statements: A complete breakdown of Amdocs Limited’s financials.
- Interactive Dashboard: Visualize valuation results and projections dynamically.
Disclaimer
All information, articles, and product details provided on this website are for general informational and educational purposes only. We do not claim any ownership over, nor do we intend to infringe upon, any trademarks, copyrights, logos, brand names, or other intellectual property mentioned or depicted on this site. Such intellectual property remains the property of its respective owners, and any references here are made solely for identification or informational purposes, without implying any affiliation, endorsement, or partnership.
We make no representations or warranties, express or implied, regarding the accuracy, completeness, or suitability of any content or products presented. Nothing on this website should be construed as legal, tax, investment, financial, medical, or other professional advice. In addition, no part of this site—including articles or product references—constitutes a solicitation, recommendation, endorsement, advertisement, or offer to buy or sell any securities, franchises, or other financial instruments, particularly in jurisdictions where such activity would be unlawful.
All content is of a general nature and may not address the specific circumstances of any individual or entity. It is not a substitute for professional advice or services. Any actions you take based on the information provided here are strictly at your own risk. You accept full responsibility for any decisions or outcomes arising from your use of this website and agree to release us from any liability in connection with your use of, or reliance upon, the content or products found herein.