
|
Durect Corporation (DRRX) Évaluation DCF |
Entièrement Modifiable: Adapté À Vos Besoins Dans Excel Ou Sheets
Conception Professionnelle: Modèles Fiables Et Conformes Aux Normes Du Secteur
Pré-Construits Pour Une Utilisation Rapide Et Efficace
Compatible MAC/PC, entièrement débloqué
Aucune Expertise N'Est Requise; Facile À Suivre
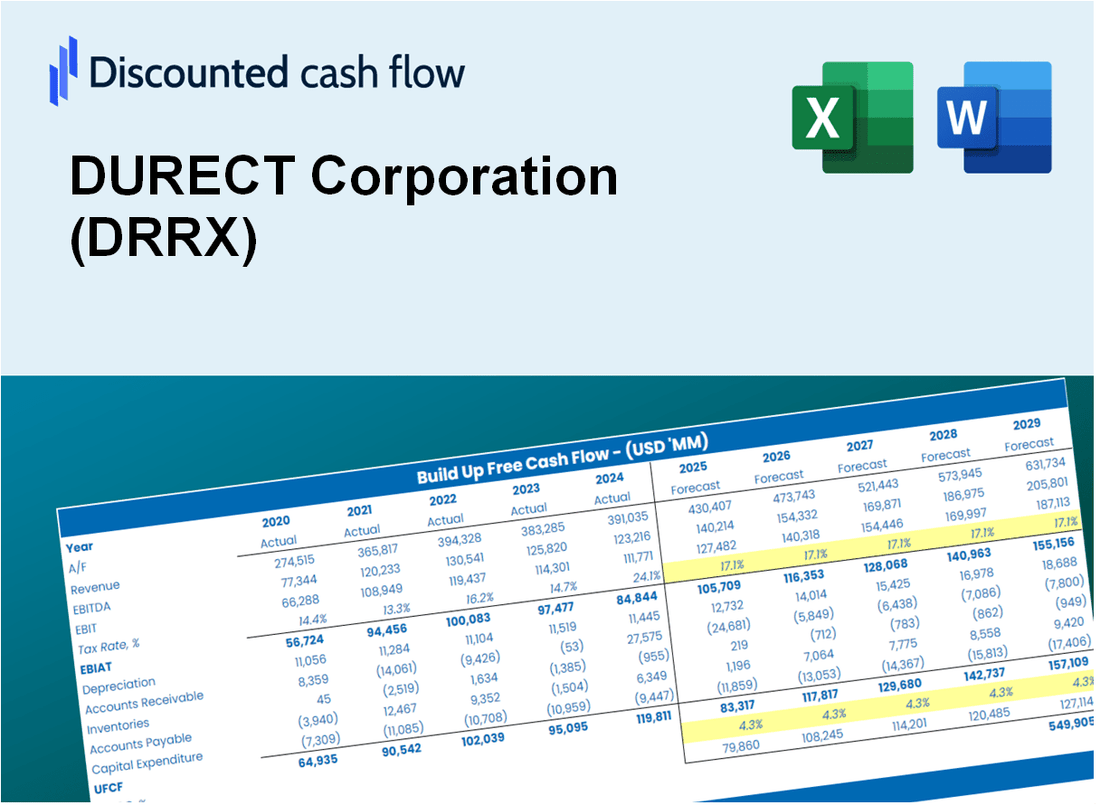
DURECT Corporation (DRRX) Bundle
Améliorez vos choix d'investissement avec la calculatrice DCF de Durect Corporation (DRRX)! Explorez les données financières réelles de Durect, ajustez les projections et dépenses de croissance et observez instantanément comment ces changements affectent la valeur intrinsèque de Durect Corporation (DRRX).
What You Will Receive
- Comprehensive Financial Model: DURECT Corporation's (DRRX) actual data provides an accurate basis for DCF valuation.
- Complete Forecasting Control: Modify revenue growth, profit margins, WACC, and other essential parameters.
- Real-Time Calculations: Automatic updates allow you to view results instantly as adjustments are made.
- Professional-Grade Template: A polished Excel file crafted for high-quality valuation presentations.
- Flexible and Reusable: Designed for adaptability, enabling repeated application for in-depth forecasts.
Key Features
- Comprehensive DCF Calculator: Features both unlevered and levered DCF valuation models tailored for DURECT Corporation (DRRX).
- WACC Calculator: A ready-to-use Weighted Average Cost of Capital sheet with adjustable parameters for precise calculations.
- Customizable Forecast Assumptions: Easily alter growth projections, capital expenditures, and discount rates to fit your analysis.
- Integrated Financial Ratios: Evaluate profitability, leverage, and efficiency ratios specifically for DURECT Corporation (DRRX).
- Interactive Dashboard and Charts: Visual representations that condense essential valuation metrics for straightforward interpretation.
How It Works
- Step 1: Download the Excel file.
- Step 2: Review pre-entered DURECT Corporation (DRRX) data (historical and projected).
- Step 3: Adjust key assumptions (yellow cells) based on your analysis.
- Step 4: View automatic recalculations for DURECT Corporation’s intrinsic value.
- Step 5: Use the outputs for investment decisions or reporting.
Why Choose This Calculator for DURECT Corporation (DRRX)?
- User-Friendly Interface: Tailored for both novice and seasoned users.
- Customizable Inputs: Adjust parameters effortlessly to suit your evaluation needs.
- Real-Time Feedback: Observe immediate updates to DURECT’s valuation as you tweak inputs.
- Pre-Loaded Data: Comes with DURECT’s actual financial metrics for swift analysis.
- Preferred by Experts: A go-to tool for investors and analysts seeking reliable insights.
Who Should Use This Product?
- Individual Investors: Make informed decisions about buying or selling DURECT Corporation (DRRX) stock.
- Financial Analysts: Streamline valuation processes with ready-to-use financial models specific to DURECT Corporation (DRRX).
- Consultants: Deliver professional valuation insights on DURECT Corporation (DRRX) to clients quickly and accurately.
- Business Owners: Understand how biopharmaceutical companies like DURECT Corporation (DRRX) are valued to guide your own strategy.
- Finance Students: Learn valuation techniques using real-world data and scenarios related to DURECT Corporation (DRRX).
What the Template Contains
- Comprehensive DCF Model: Editable template featuring detailed valuation calculations for DURECT Corporation (DRRX).
- Real-World Data: DURECT’s historical and projected financials preloaded for thorough analysis.
- Customizable Parameters: Modify WACC, growth rates, and tax assumptions to explore various scenarios.
- Financial Statements: Complete annual and quarterly breakdowns for enhanced insights into DURECT Corporation (DRRX).
- Key Ratios: Integrated analysis for profitability, efficiency, and leverage specific to DURECT Corporation (DRRX).
- Dashboard with Visual Outputs: Charts and tables providing clear, actionable results tailored to DURECT Corporation (DRRX).
Disclaimer
All information, articles, and product details provided on this website are for general informational and educational purposes only. We do not claim any ownership over, nor do we intend to infringe upon, any trademarks, copyrights, logos, brand names, or other intellectual property mentioned or depicted on this site. Such intellectual property remains the property of its respective owners, and any references here are made solely for identification or informational purposes, without implying any affiliation, endorsement, or partnership.
We make no representations or warranties, express or implied, regarding the accuracy, completeness, or suitability of any content or products presented. Nothing on this website should be construed as legal, tax, investment, financial, medical, or other professional advice. In addition, no part of this site—including articles or product references—constitutes a solicitation, recommendation, endorsement, advertisement, or offer to buy or sell any securities, franchises, or other financial instruments, particularly in jurisdictions where such activity would be unlawful.
All content is of a general nature and may not address the specific circumstances of any individual or entity. It is not a substitute for professional advice or services. Any actions you take based on the information provided here are strictly at your own risk. You accept full responsibility for any decisions or outcomes arising from your use of this website and agree to release us from any liability in connection with your use of, or reliance upon, the content or products found herein.