
|
Destination XL Group, Inc. (DXLG) Évaluation DCF |
Entièrement Modifiable: Adapté À Vos Besoins Dans Excel Ou Sheets
Conception Professionnelle: Modèles Fiables Et Conformes Aux Normes Du Secteur
Pré-Construits Pour Une Utilisation Rapide Et Efficace
Compatible MAC/PC, entièrement débloqué
Aucune Expertise N'Est Requise; Facile À Suivre
Destination XL Group, Inc. (DXLG) Bundle
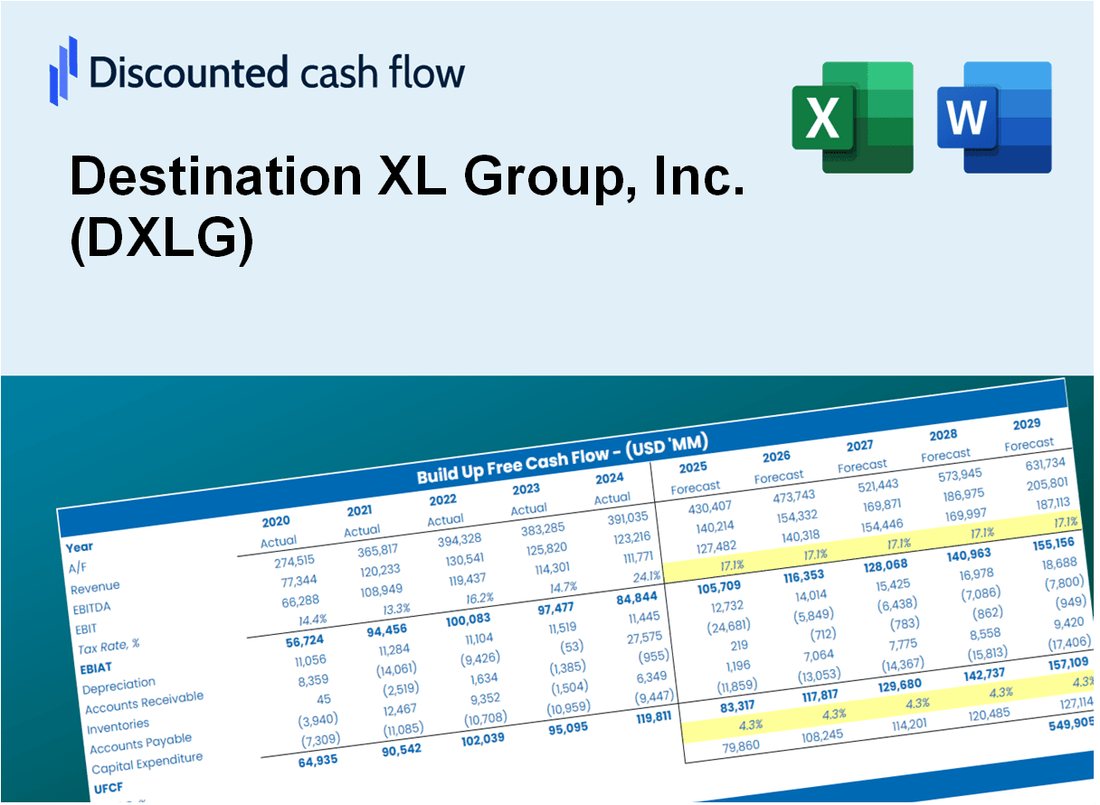
Rationalisez votre analyse et améliorez la précision avec notre calculatrice DCF (DXLG)! En utilisant de vraies données de Destination XL Group, Inc. et des hypothèses personnalisables, cet outil vous permet de prévoir, analyser et valoriser (DXLG) comme un investisseur chevronné.
What You Will Get
- Pre-Filled Financial Model: Destination XL Group's actual data allows for accurate DCF valuation.
- Full Forecast Control: Modify revenue growth, profit margins, WACC, and other essential factors.
- Instant Calculations: Automatic updates provide real-time results as you adjust inputs.
- Investor-Ready Template: A polished Excel file crafted for high-quality valuation presentations.
- Customizable and Reusable: Designed for adaptability, making it suitable for multiple detailed forecasts.
Key Features
- Comprehensive DXLG Data: Pre-loaded with Destination XL Group’s historical performance metrics and future growth estimates.
- Customizable Financial Inputs: Modify revenue forecasts, profit margins, discount rates, tax implications, and capital investments.
- Interactive Valuation Framework: Automatic recalculations of Net Present Value (NPV) and intrinsic value based on user-defined parameters.
- Scenario Analysis: Develop various forecasting scenarios to explore different valuation possibilities.
- User-Centric Interface: Intuitive layout designed for both industry experts and novices.
How It Works
- 1. Access the Template: Download and open the Excel file featuring Destination XL Group, Inc.'s (DXLG) preloaded data.
- 2. Modify Assumptions: Adjust essential inputs such as growth rates, WACC, and capital expenditures.
- 3. View Results Instantly: The DCF model automatically calculates intrinsic value and NPV.
- 4. Explore Scenarios: Evaluate various forecasts to assess different valuation possibilities.
- 5. Present with Confidence: Share professional valuation insights to back your strategic decisions.
Why Choose This Calculator for Destination XL Group, Inc. (DXLG)?
- User-Friendly Interface: Tailored for both novices and seasoned professionals.
- Customizable Inputs: Adjust parameters easily to suit your financial analysis.
- Real-Time Feedback: Observe immediate updates to DXLG's valuation as you modify inputs.
- Pre-Loaded Data: Comes with Destination XL's actual financial metrics for swift evaluations.
- Relied Upon by Experts: Favored by investors and analysts for making well-informed choices.
Who Should Use This Product?
- Fashion Enthusiasts: Discover trends and styles while utilizing real-time data from DXLG.
- Retail Analysts: Integrate industry models into your research or business strategies.
- Investors: Validate your investment strategies and assess valuation metrics for Destination XL Group, Inc. (DXLG).
- Market Researchers: Optimize your analysis with a ready-to-use, adaptable financial model.
- Entrepreneurs: Understand how large retail companies like DXLG are evaluated in the market.
What the Template Contains
- Historical Data: Includes Destination XL Group, Inc.'s (DXLG) past financials and baseline forecasts.
- DCF and Levered DCF Models: Detailed templates to calculate Destination XL Group, Inc.'s (DXLG) intrinsic value.
- WACC Sheet: Pre-built calculations for Weighted Average Cost of Capital.
- Editable Inputs: Modify key drivers like growth rates, EBITDA %, and CAPEX assumptions.
- Quarterly and Annual Statements: A complete breakdown of Destination XL Group, Inc.'s (DXLG) financials.
- Interactive Dashboard: Visualize valuation results and projections dynamically.
Disclaimer
All information, articles, and product details provided on this website are for general informational and educational purposes only. We do not claim any ownership over, nor do we intend to infringe upon, any trademarks, copyrights, logos, brand names, or other intellectual property mentioned or depicted on this site. Such intellectual property remains the property of its respective owners, and any references here are made solely for identification or informational purposes, without implying any affiliation, endorsement, or partnership.
We make no representations or warranties, express or implied, regarding the accuracy, completeness, or suitability of any content or products presented. Nothing on this website should be construed as legal, tax, investment, financial, medical, or other professional advice. In addition, no part of this site—including articles or product references—constitutes a solicitation, recommendation, endorsement, advertisement, or offer to buy or sell any securities, franchises, or other financial instruments, particularly in jurisdictions where such activity would be unlawful.
All content is of a general nature and may not address the specific circumstances of any individual or entity. It is not a substitute for professional advice or services. Any actions you take based on the information provided here are strictly at your own risk. You accept full responsibility for any decisions or outcomes arising from your use of this website and agree to release us from any liability in connection with your use of, or reliance upon, the content or products found herein.