
|
Exceller Energy, Inc. (EE): 5 Analyse des forces [Jan-2025 Mis à jour] |
Entièrement Modifiable: Adapté À Vos Besoins Dans Excel Ou Sheets
Conception Professionnelle: Modèles Fiables Et Conformes Aux Normes Du Secteur
Pré-Construits Pour Une Utilisation Rapide Et Efficace
Compatible MAC/PC, entièrement débloqué
Aucune Expertise N'Est Requise; Facile À Suivre
Excelerate Energy, Inc. (EE) Bundle
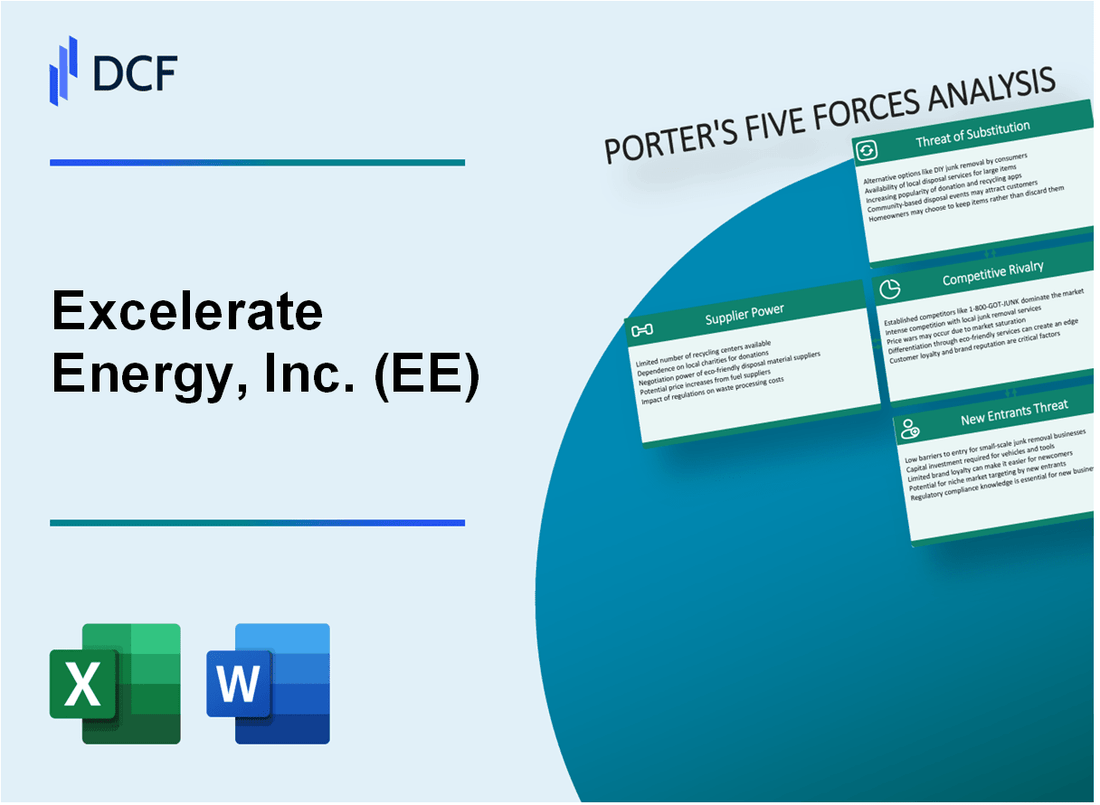
Dans le monde dynamique de l'infrastructure énergétique mondiale, Excerate Energy, Inc. (EE) navigue dans un paysage complexe de défis et d'opportunités stratégiques. En disséquant le cadre des cinq forces de Michael Porter, nous dévoilons la dynamique complexe qui façonne le positionnement concurrentiel de l'entreprise sur le marché des services de transport et de regasfication du gaz naturel liquéfié (GNL). Du pouvoir de négociation nuancé des fournisseurs et des clients aux menaces évolutives des substituts et des nouveaux entrants, cette analyse fournit une lentille complète dans les considérations stratégiques qui définissent le paysage concurrentiel de l'exercice de l'énergie en 2024.
Exceller Energy, Inc. (EE) - Porter's Five Forces: Bargaining Power des fournisseurs
Nombre limité de fabricants de navires et de terminaux spécialisés
En 2024, le marché mondial de la fabrication de navires de GNL est dominé par quelques acteurs clés:
| Fabricant | Part de marché | Production annuelle des navires de GNL |
|---|---|---|
| Hyundai Heavy Industries | 35% | 12-15 navires / an |
| Samsung Heavy Industries | 25% | 8-10 navires / an |
| DSME (Daewoo Shipbuilding) | 20% | 6-8 navires / an |
Exigences d'investissement en capital élevé
Infrastructure de GNL Coûts en capital:
- Construction de navires de GNL: 180 $ - 250 millions de dollars par navire
- Terminal de GNL offshore: 500 millions de dollars - 1,2 milliard de dollars
- Terminal GNL à terre: 300 millions de dollars - 750 millions de dollars
Dépendance aux principaux fournisseurs d'équipement
| Fournisseur d'équipement | Équipement spécialisé | Domination du marché |
|---|---|---|
| Ge | Turbines de GNL | 62% de part de marché mondiale |
| Siemens | Systèmes de compression | 28% de part de marché mondiale |
Partenariats stratégiques
Partenariats principaux de fournisseurs d'équipements maritimes et énergétiques à partir de 2024:
- Shell Western GNL
- Mitsubishi Heavy Industries
- Wartsila Corporation
Complexité technique réduisant les alternatives des fournisseurs
Métriques de complexité technique:
- Processus de qualification de la chaîne d'approvisionnement du GNL: 18-24 mois
- Exigences de conformité technique: 127 Normes spécifiques
- Coût de certification de l'équipement: 2,3 à 4,7 millions de dollars par certification
Exceller Energy, Inc. (EE) - Porter's Five Forces: Bargaining Power of Clients
Grands services publics énergétiques et clients industriels
En 2024, Excelerate Energy sert 15 grands services publics énergétiques à travers l'Asie, l'Europe et les Amériques. Les meilleurs clients comprennent:
| Client | Région | Volume annuel de GNL (MMCF) |
|---|---|---|
| Petronas | Asie | 187,500 |
| Coquille | Europe | 156,300 |
| Cfe | Amériques | 132,750 |
Contrats à long terme
Exceller Energy a 7 contrats à long terme avec une durée moyenne de 12,3 ans, ce qui réduit l'effet de levier de négociation des clients.
Demande mondiale de transport de GNL
- Volume mondial du commerce de GNL: 458 millions de tonnes en 2023
- Taux de croissance projeté: 3,4% par an jusqu'en 2030
- Exceller la part de marché de l'énergie: 2,7%
Sensibilité aux prix
Les prix actuels du SPOT du GNL varient entre 8 et 12 $ par million de BTU, les prix du contrat Excelerate Energy d'une moyenne de 9,65 $.
Concentration du client
| Région | Nombre de clients | Pourcentage de revenus |
|---|---|---|
| Asie | 6 | 42% |
| Europe | 5 | 33% |
| Amériques | 4 | 25% |
Exceller Energy, Inc. (EE) - Porter's Five Forces: Rivalry compétitif
Concurrence mondiale du marché mondial du GNL mondial
Depuis 2024, le marché mondial du transport et de la regasfication du GNL présente une dynamique concurrentielle importante:
| Concurrent | Part de marché (%) | Revenus annuels (USD) |
|---|---|---|
| Énergie de chenière | 18.5% | 9,7 milliards de dollars |
| Coquille | 22.3% | 14,2 milliards de dollars |
| Exceller l'énergie | 8.7% | 3,6 milliards de dollars |
Caractéristiques clés du paysage concurrentiel
Les facteurs compétitifs comprennent:
- Taille de la flotte: 7 unités de stockage et de regasfication flottantes (FSRU)
- Présence opérationnelle dans 5 pays
- Capacité de regasfication totale: 13,5 milliards de mètres cubes par an
Métriques d'innovation technologique
| Paramètre d'innovation | Exceller les performances énergétiques |
|---|---|
| Efficacité technologique FSRU | 92,4% de fiabilité opérationnelle |
| Investissement de transformation numérique | 42 millions de dollars en 2023 |
Expansion du marché géographique
- Régions opérationnelles actuelles: Amériques, Moyen-Orient, Asie
- Entrée du marché planifié: 2 nouveaux pays d'ici 2025
- Pénétration du marché international projeté: augmentation de 12%
Stratégie de tarification compétitive
Indicateurs de compétitivité des prix:
| Tarification métrique | Valeur |
|---|---|
| Coût moyen de transport | 0,65 $ par million de BTU |
| Marge de service de regasification | 18.3% |
Exceller Energy, Inc. (EE) - Five Forces de Porter: menace de substituts
Augmentation des alternatives d'énergie renouvelable
La capacité solaire mondiale a atteint 1 185 GW en 2022. La capacité d'énergie éolienne a totalisé 743 GW dans le monde. Les investissements en énergie renouvelable ont atteint 495 milliards de dollars en 2022.
| Type d'énergie renouvelable | Capacité mondiale (2022) | Croissance d'une année à l'autre |
|---|---|---|
| Solaire | 1 185 GW | 26% |
| Vent | 743 GW | 17% |
Augmentation de la décarbonisation mondiale Focus
Les engagements mondiaux de réduction du carbone ciblent 45% de réduction des émissions d'ici 2030. 136 pays ont des objectifs nets zéro en 2023.
Hydrogène et technologies d'énergie propre émergente
Le marché mondial de l'hydrogène devrait atteindre 155 milliards de dollars d'ici 2026. La capacité d'électrolyzer devrait passer à 134 GW d'ici 2030.
| Technologie | Valeur marchande | Croissance projetée |
|---|---|---|
| Hydrogène vert | 155 milliards de dollars | 54% CAGR |
Gas naturel comme carburant de transition
Le gaz naturel représente 22% du mélange énergétique mondial. Réserves estimées de gaz naturel mondial: 188,1 billions de mètres cubes.
Influences de la politique énergétique régionale
La Loi sur la réduction de l'inflation des États-Unis a alloué 369 milliards de dollars pour les investissements en énergie propre. L'Union européenne cible 42,5% d'énergie renouvelable d'ici 2030.
| Région | Investissement en énergie propre | Cible renouvelable |
|---|---|---|
| États-Unis | 369 milliards de dollars | 30% d'ici 2030 |
| Union européenne | 277 milliards de dollars | 42,5% d'ici 2030 |
Exceller Energy, Inc. (EE) - Five Forces de Porter: menace de nouveaux entrants
Exigences de capital élevé pour l'infrastructure de GNL
L'exceller l'infrastructure de GNL de l'énergie nécessite un investissement en capital estimé de 500 millions à 1,2 milliard de dollars pour le développement du terminal et des navires. Les coûts spécialisés de construction de transporteurs de GNL varient de 180 millions de dollars à 250 millions de dollars par navire.
| Composant d'infrastructure | Investissement en capital estimé |
|---|---|
| Unité de stockage flottante et de régulation de GNL (FSRU) | 350 à 500 millions de dollars |
| Navire de transporteur de GNL | 180 à 250 millions de dollars |
| Infrastructure terminale | 150 à 450 millions de dollars |
Exigences d'expertise technologique
Compétences technologiques spécialisées Incluez une génie maritime avancé, une manipulation cryogénique et des technologies de régularisation complexes.
- Systèmes avancés de navigation maritime
- Capacités de manutention du GNL cryogénique
- Ingénierie de regasification complexe
- Systèmes de surveillance et de sécurité en temps réel
Barrières réglementaires
Les réglementations internationales sur le marché maritime et de l'énergie imposent des barrières d'entrée importantes. Les coûts de conformité peuvent dépasser 10 à 15 millions de dollars par an pour les nouveaux entrants du marché.
| Zone de conformité réglementaire | Coût annuel estimé |
|---|---|
| Certifications de sécurité maritime | 3 à 5 millions de dollars |
| Conformité environnementale | 4 à 6 millions de dollars |
| Règlement sur l'énergie internationale | 3 à 4 millions de dollars |
Investissement initial dans des navires spécialisés
Les navires spécialisés du transporteur de GNL nécessitent des investissements initiaux substantiels, avec des coûts de cycle de vie typiques des navires allant de 350 à 500 millions de dollars.
Relations et contrats établis
Exceller Energy maintient des contrats à long terme d'une valeur d'environ 750 millions de dollars, créant d'importantes obstacles à l'entrée sur le marché pour les concurrents potentiels.
| Type de contrat | Valeur estimée | Durée |
|---|---|---|
| Accords d'approvisionnement à long terme de GNL | 500 millions de dollars | 10-15 ans |
| Contrats de fonctionnement du terminal | 250 millions de dollars | 5-10 ans |
Excelerate Energy, Inc. (EE) - Porter's Five Forces: Competitive rivalry
Rivalry is intense in the niche Floating Storage and Regasification Unit (FSRU) sector, you know. This isn't a broad energy market; it's specialized infrastructure where a few players really matter. Key competitors challenging Excelerate Energy, Inc. directly include Hoegh LNG and Golar LNG Limited. Still, the competitive set is broader, also featuring BW Group (via BW Gas), Gazprom FLEX LNG, and Exmar, among others.
The market structure itself shows high concentration, meaning the big players have significant pricing power, but also fight hard for every contract. Honestly, the top five FSRU companies command over 80% of the global market share. This concentration means that securing a new project or retaining an existing customer is a high-stakes game. The competition is definitely about who can deploy capacity fastest and offer the most reliable service.
Here's a quick look at how some of the key players stack up based on reported operational scale:
| Company | Reported FSRU Fleet Size Context | Key Operational Metric |
|---|---|---|
| Excelerate Energy, Inc. | 10 FSRUs as of March 31, 2025 (as required) | Completed over 3,000 LNG ship-to-ship transfers since 2007 |
| HÖEGH LNG AS | Reportedly built 10 FSRUs | Completed approximately 1,000 ship-to-ship operations |
| BW Group (BW Gas) | Fleet includes 34 LNG carriers and FSRUs | Part of a group managing over 490 vessels |
Excelerate Energy, Inc. maintains a strong position within this concentrated field. As of March 31, 2025, the company operates a fleet of 10 FSRUs. To back up that fleet, operational excellence is a major competitive weapon. For the full year 2024, Excelerate Energy recorded fleet reliability of 99.9%, which they noted as the highest in the history of Excelerate Technical Management. This reliability directly translates to customer confidence, which is crucial when you are providing critical energy infrastructure.
The real battleground is securing high-margin, long-term Time Charter Party (TCP) agreements. These contracts lock in revenue streams and provide the financial stability that investors, like those following the 2024 record Adjusted EBITDA of $348 million, look for. Excelerate Energy's model leans heavily on these; 85% of its revenue comes from agreements averaging 12 years in duration. Furthermore, as of December 2024, the company had $3.7 billion in cumulative contracted cash flow from these deals. The competition is fierce because winning one of these long-term contracts means securing predictable cash flow for over a decade, which is a huge differentiator against commodity price volatility.
Excelerate Energy, Inc. (EE) - Porter's Five Forces: Threat of substitutes
You're looking at the long-term headwinds for Excelerate Energy, Inc. (EE), and the biggest one is definitely the shift away from fossil fuels toward renewables. This isn't a near-term crisis for LNG, but it's the structural ceiling on long-term growth. The sheer pace of renewable energy deployment is staggering, which directly substitutes for the need for new, long-lived gas infrastructure.
Consider the scale of the competition from solar power alone. It took 68 years to reach 1,000 GW of global solar capacity, but only two years to add the next 1,000 GW, hitting a total of 2,000 GW in 2025. In just the first half of 2025, the world added 380 GW of new solar capacity. This rapid build-out means that for new power generation needs, solar is often the default, not LNG.
Still, Excelerate Energy, Inc. (EE) has a strong near-term defense because LNG is positioned as a cleaner transition fuel, which helps defer the immediate threat from coal or oil. For example, Excelerate Energy, Inc. (EE)'s FSRU Excellence in Bangladesh supports a terminal that provides a reliable source of energy supporting industrial development in a more sustainable manner. However, the pressure is mounting from global policy goals.
The global push for decarbonization means that any new, large-scale fossil fuel infrastructure faces scrutiny. While the original goal was often cited around a 45% reduction by 2030, the science for limiting warming to 1.5°C pathways suggests emissions needed to fall 40% by 2030 from 2019 levels. Even for methane, a potent short-term warmer, current national commitments are only on track to cut global emissions by about 8% below 2020 levels by 2030. This gap between ambition and reality is where Excelerate Energy, Inc. (EE) currently thrives, but it also defines the long-term risk.
The most direct physical substitute for Excelerate Energy, Inc. (EE)'s Floating Storage and Regasification Units (FSRUs) is fixed, land-based LNG terminals. Here, Excelerate Energy, Inc. (EE)'s core offering provides a clear, quantifiable advantage in speed and capital outlay, which is crucial for energy-insecure markets.
| Metric | FSRU Deployment Option | Fixed, Land-Based LNG Terminal |
|---|---|---|
| Typical Construction Time | A few months to seven months to two years | At least three to four years |
| Estimated Capital Cost (Regasification) | Around USD 300 million, or less than US$100 million | Far heftier, around $1 billion |
| Flexibility | Flexible; can be relocated | Permanent infrastructure |
The cost difference is stark: a fixed terminal can cost upwards of $1 billion, while securing an FSRU can cost around $40 million or require an investment of about USD 300 million to build. This lower capital expenditure, combined with faster deployment, makes the FSRU model the preferred choice for many new importers, especially as some established markets plan to replace temporary FSRUs with permanent ones between 2026-27. Excelerate Energy, Inc. (EE) operates one of the world's largest fleets, with 10 or 11 vessels, and they are actively growing this fleet, expecting committed growth capital for 2025 to be between $95 million and $105 million.
The threat from substitutes is mitigated by the current market structure and Excelerate Energy, Inc. (EE)'s contract profile, but the long-term trajectory is clear. You need to watch how quickly the global energy mix shifts.
- Excelerate Energy, Inc. (EE) Revised 2025 Adjusted EBITDA guidance: $420 million to $440 million.
- Excelerate Energy, Inc. (EE) unrestricted cash as of June 30, 2025: $426.0 million.
- New FSRU for Excelerate Energy, Inc. (EE) (Hull 3407) delivery scheduled for 2026.
- Global LNG supply expected to grow from approximately 430 million tonnes per annum in 2025 to greater than 600 mtpa by 2030.
- Solar PV capacity reached 2,000 GW in 2025.
Excelerate Energy, Inc. (EE) - Porter's Five Forces: Threat of new entrants
The threat of new entrants for Excelerate Energy, Inc. is currently low, primarily because the barriers to entry in the Floating Storage and Regasification Unit (FSRU) and integrated LNG infrastructure space are substantial. You're looking at a market that requires deep pockets and proven operational history, which immediately filters out most potential competitors.
Barriers are high due to the massive capital outlay; a new offshore LNG terminal costs, as generally cited, between $500 million to $1.2 billion. While we don't have a direct 2025 quote for a greenfield offshore terminal, we see the scale of commitment required in Excelerate Energy, Inc.'s recent projects. For instance, the total project investment for the fully integrated LNG import terminal in Iraq, which includes deploying the new build FSRU Hull 3407, is expected to be approximately $450 million. Also, the acquisition of New Fortress Energy's Jamaican LNG-to-power assets, which included two terminals, cost $1.055 billion. These figures show you the kind of capital commitment needed just to enter the space, let alone build a competitive fleet.
Specialized expertise and intellectual property in FSRU operations are defintely difficult to replicate quickly. Excelerate Energy, Inc. has built a reputation on reliability, recording a full-year fleet reliability of 99.9% for 2024. Furthermore, their operational experience is deep; they celebrated their 3,000th liquefied natural gas ship-to-ship transfer since starting those operations in 2007. New players lack this track record, which is critical when negotiating with sovereign nations for long-term energy security contracts.
Long-term contracts tie up the most attractive demand, making it hard for newcomers to secure anchor customers. As of February 21, 2025, excluding two evergreen contracts, the minimum contracted cash flows under Excelerate Energy, Inc.'s time charter and terminal use contracts stood at approximately $3.6 billion, with a weighted average remaining term of 7.4 years. This is a significant amount of revenue already locked in. For context, the prompt mentioned an average charter period of 6.3 years (2022), but the latest data shows this has extended, with the Pro Forma weighted average remaining contract term, including Jamaica extensions, reaching ~10-years as of December 31, 2024. Excelerate Energy, Inc. currently operates 12 vessels and holds an estimated 25% market share of the total global floating regasification capacity in operation as of the end of 2024.
Regulatory hurdles and permitting requirements for new LNG infrastructure are complex and time-consuming. While specific timelines for new entrants are not public, the industry is known for stringent environmental and safety regulations governing construction and operation. Excelerate Energy, Inc.'s established relationships with host governments, as seen in recent deals with Germany and Iraq, suggest that navigating this landscape is a significant, time-consuming barrier that only incumbents can effectively manage.
Here's a quick look at the hard numbers underpinning these high barriers:
| Metric | Value | Date/Context |
|---|---|---|
| Estimated New Offshore Terminal Cost (Prompt) | $500 million to $1.2 billion | General Barrier |
| Iraq Integrated Terminal Project Cost | Approx. $450 million | Includes FSRU Hull 3407 |
| Jamaica Assets Acquisition Cost | $1.055 billion | Completed late 2024 |
| Weighted Average Remaining Contract Term | 7.4 years | As of February 21, 2025 |
| Minimum Contracted Cash Flows | Approx. $3.6 billion | As of February 21, 2025 |
| Fleet Reliability (2024) | 99.9% | |
| Total FSRU Fleet Size | 12 vessels | (11 operating, one under construction) |
The high capital requirement, coupled with the need for a proven operational history, means that any new entrant must secure massive financing and then successfully execute complex, multi-year projects to even approach Excelerate Energy, Inc.'s established position. You can see the commitment in their 2025 guidance, with committed growth CapEx expected to be between $95 million and $105 million for the year.
The existing market structure presents several hurdles for new players:
- Securing long-term, investment-grade counterparties is difficult.
- Fleet deployment requires multi-year shipbuilding commitments.
- Navigating international permitting processes takes years.
- Operational excellence, like 99.9% reliability, is hard to achieve fast.
- The company already holds an estimated 25% share of the global FSRU capacity.
Finance: draft 13-week cash view by Friday.
Disclaimer
All information, articles, and product details provided on this website are for general informational and educational purposes only. We do not claim any ownership over, nor do we intend to infringe upon, any trademarks, copyrights, logos, brand names, or other intellectual property mentioned or depicted on this site. Such intellectual property remains the property of its respective owners, and any references here are made solely for identification or informational purposes, without implying any affiliation, endorsement, or partnership.
We make no representations or warranties, express or implied, regarding the accuracy, completeness, or suitability of any content or products presented. Nothing on this website should be construed as legal, tax, investment, financial, medical, or other professional advice. In addition, no part of this site—including articles or product references—constitutes a solicitation, recommendation, endorsement, advertisement, or offer to buy or sell any securities, franchises, or other financial instruments, particularly in jurisdictions where such activity would be unlawful.
All content is of a general nature and may not address the specific circumstances of any individual or entity. It is not a substitute for professional advice or services. Any actions you take based on the information provided here are strictly at your own risk. You accept full responsibility for any decisions or outcomes arising from your use of this website and agree to release us from any liability in connection with your use of, or reliance upon, the content or products found herein.