
|
Edison International (EIX) Évaluation DCF |
Entièrement Modifiable: Adapté À Vos Besoins Dans Excel Ou Sheets
Conception Professionnelle: Modèles Fiables Et Conformes Aux Normes Du Secteur
Pré-Construits Pour Une Utilisation Rapide Et Efficace
Compatible MAC/PC, entièrement débloqué
Aucune Expertise N'Est Requise; Facile À Suivre
Edison International (EIX) Bundle
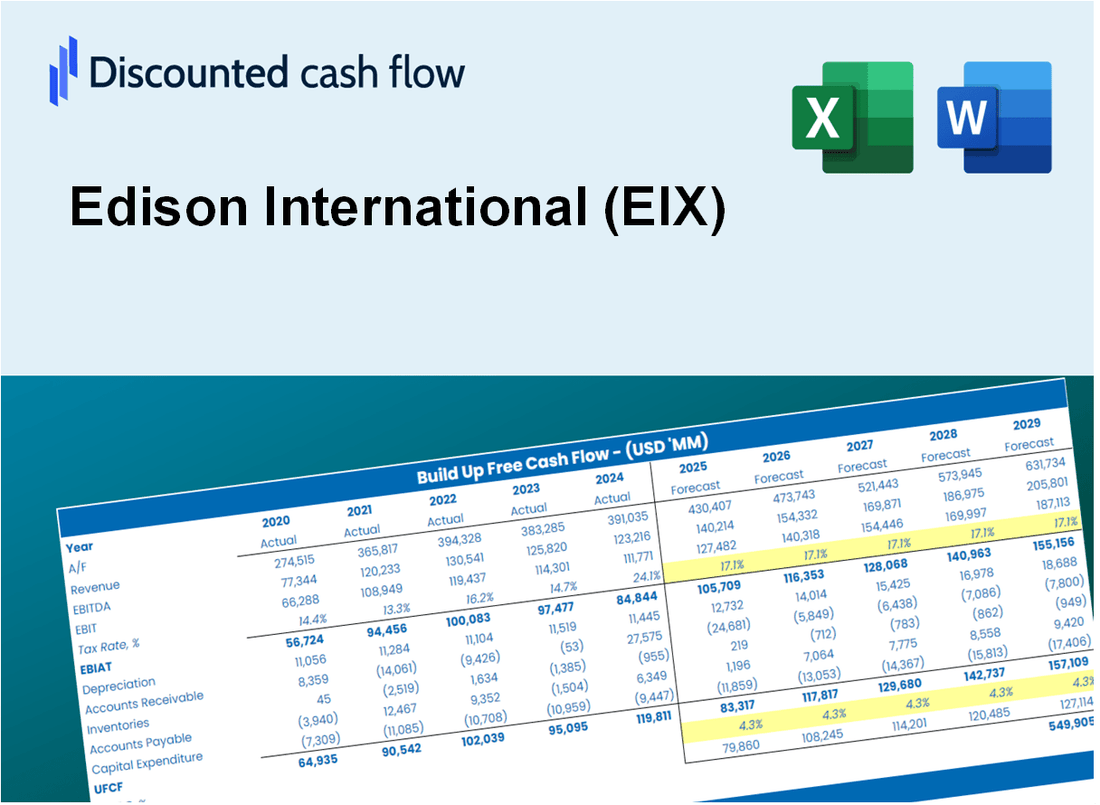
Explorez les perspectives financières d'Edison International (EIX) avec notre calculatrice DCF conviviale! Entrez vos projections pour la croissance, les marges et les dépenses pour calculer la valeur intrinsèque d'Edison International (EIX) et affiner votre approche d'investissement.
What You Will Receive
- Genuine Edison Data: Preloaded financials – encompassing revenue to EBIT – based on real and projected metrics.
- Complete Customization: Modify all essential parameters (yellow cells) such as WACC, growth %, and tax rates.
- Immediate Valuation Adjustments: Automatic recalculations to assess the effect of changes on Edison’s fair value.
- Flexible Excel Template: Designed for quick modifications, scenario analysis, and comprehensive projections.
- Efficient and Precise: Avoid constructing models from the ground up while ensuring accuracy and adaptability.
Key Features
- Comprehensive EIX Data: Pre-populated with Edison International’s historical performance and future outlook.
- Customizable Assumptions: Modify growth rates, profit margins, discount rates, tax implications, and capital investments.
- Interactive Valuation Framework: Automatic recalculations of Net Present Value (NPV) and intrinsic value based on user inputs.
- Scenario Analysis: Develop various forecasting scenarios to evaluate different valuation possibilities.
- Intuitive User Interface: Clear, organized, and tailored for both seasoned professionals and newcomers.
How It Works
- 1. Access the Template: Download and open the Excel file featuring Edison International’s (EIX) preloaded data.
- 2. Modify Assumptions: Adjust essential inputs such as growth rates, WACC, and capital expenditures.
- 3. View Results Instantly: The DCF model automatically calculates intrinsic value and NPV in real-time.
- 4. Explore Scenarios: Evaluate various forecasts to understand different valuation results.
- 5. Present with Assurance: Deliver expert valuation insights to bolster your decision-making process.
Why Choose This Calculator for Edison International (EIX)?
- All-in-One Solution: Combines DCF, WACC, and financial ratio assessments tailored for Edison International (EIX).
- Flexible Inputs: Modify the yellow-highlighted fields to explore different financial scenarios.
- In-Depth Analysis: Automatically computes Edison International’s intrinsic value and Net Present Value.
- Preloaded Metrics: Historical and projected data provide reliable starting figures.
- High-Quality Tool: Perfect for financial analysts, investors, and business advisors focused on Edison International (EIX).
Who Should Use This Product?
- Finance Students: Discover valuation methods and apply them using actual data for Edison International (EIX).
- Academics: Integrate industry-standard models into your lectures or research involving Edison International (EIX).
- Investors: Validate your investment hypotheses and evaluate valuation results for Edison International (EIX).
- Analysts: Enhance your analysis process with a ready-to-use, customizable DCF model tailored for Edison International (EIX).
- Small Business Owners: Understand the valuation techniques used for analyzing large corporations like Edison International (EIX).
What the Template Contains
- Pre-Filled Data: Includes Edison International’s historical financials and forecasts.
- Discounted Cash Flow Model: Editable DCF valuation model with automatic calculations.
- Weighted Average Cost of Capital (WACC): A dedicated sheet for calculating WACC based on custom inputs.
- Key Financial Ratios: Analyze Edison International’s profitability, efficiency, and leverage.
- Customizable Inputs: Edit revenue growth, margins, and tax rates with ease.
- Clear Dashboard: Charts and tables summarizing key valuation results.
Disclaimer
All information, articles, and product details provided on this website are for general informational and educational purposes only. We do not claim any ownership over, nor do we intend to infringe upon, any trademarks, copyrights, logos, brand names, or other intellectual property mentioned or depicted on this site. Such intellectual property remains the property of its respective owners, and any references here are made solely for identification or informational purposes, without implying any affiliation, endorsement, or partnership.
We make no representations or warranties, express or implied, regarding the accuracy, completeness, or suitability of any content or products presented. Nothing on this website should be construed as legal, tax, investment, financial, medical, or other professional advice. In addition, no part of this site—including articles or product references—constitutes a solicitation, recommendation, endorsement, advertisement, or offer to buy or sell any securities, franchises, or other financial instruments, particularly in jurisdictions where such activity would be unlawful.
All content is of a general nature and may not address the specific circumstances of any individual or entity. It is not a substitute for professional advice or services. Any actions you take based on the information provided here are strictly at your own risk. You accept full responsibility for any decisions or outcomes arising from your use of this website and agree to release us from any liability in connection with your use of, or reliance upon, the content or products found herein.