
|
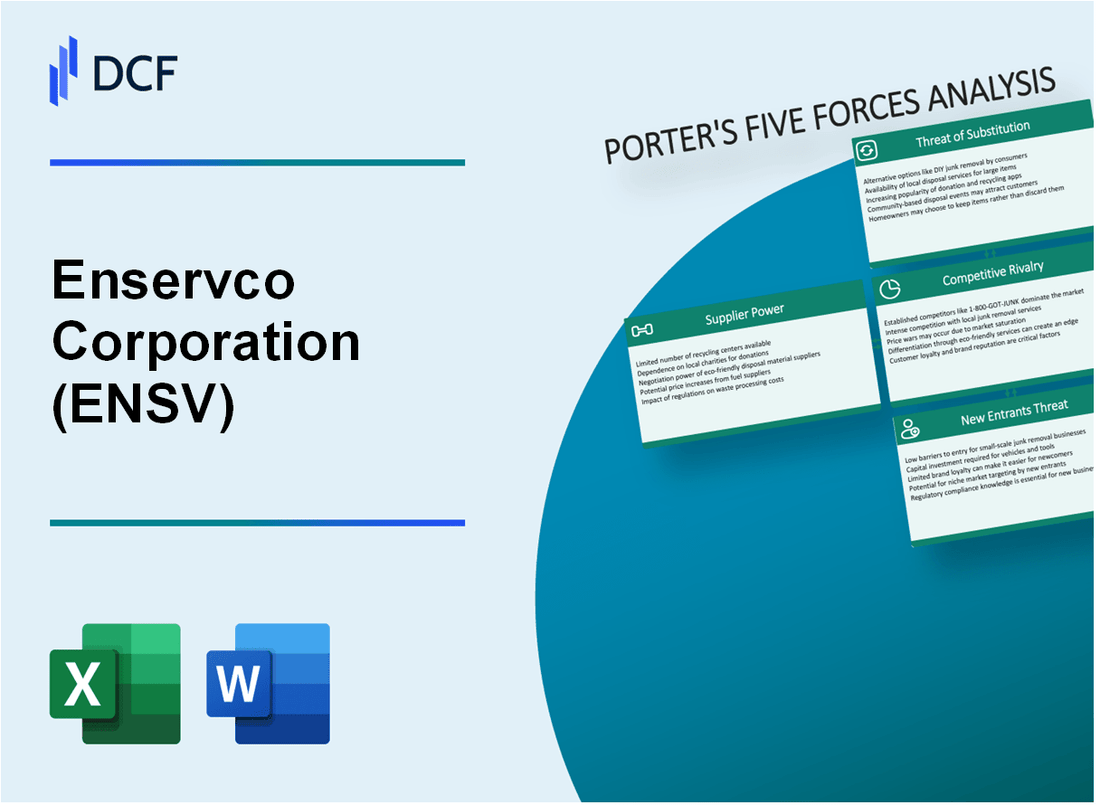
Enservco Corporation (ENSV): 5 Analyse des forces [Jan-2025 MISE À JOUR] |
Entièrement Modifiable: Adapté À Vos Besoins Dans Excel Ou Sheets
Conception Professionnelle: Modèles Fiables Et Conformes Aux Normes Du Secteur
Pré-Construits Pour Une Utilisation Rapide Et Efficace
Compatible MAC/PC, entièrement débloqué
Aucune Expertise N'Est Requise; Facile À Suivre
Enservco Corporation (ENSV) Bundle
Dans le paysage dynamique des services de pétrole et de gaz, Enservco Corporation (ENSV) navigue dans un écosystème complexe de forces compétitives qui façonnent son positionnement stratégique et son potentiel de marché. As energy markets evolve and technological innovations reshape traditional extraction methodologies, understanding the intricate dynamics of supplier power, customer relationships, competitive pressures, potential substitutes, and barriers to entry becomes crucial for investors and industry analysts seeking to comprehend the company's resilience and growth trajectory in Un secteur des services énergétiques de plus en plus difficile.
Enservco Corporation (ENSV) - Porter's Five Forces: Bangaining Power of Fournissers
Paysage des fabricants d'équipements spécialisés
En 2024, Enservco Corporation est confrontée à un marché des fournisseurs concentrés avec environ 7 à 9 fabricants d'équipements de fracturation hydraulique majeurs dans le monde.
| Catégorie d'équipement | Nombre de fournisseurs | Concentration du marché |
|---|---|---|
| Équipement de fracturation hydraulique | 8 | Haut |
| Machinerie de stimulation bien | 6 | Modéré à élevé |
Analyse de dépendance des fournisseurs clés
Enservco Corporation démontre une dépendance significative à l'égard des fournisseurs spécialisés:
- 3-4 fournisseurs critiques fournissent 70 à 80% des équipements de fracturation hydrauliques spécialisés
- Coûts de remplacement de la chaîne d'approvisionnement estimés à 2,5 à 3,7 millions de dollars par ensemble d'équipement
- L'équipement moyen que le délai de livraison varie entre 6 et 9 mois
Contraintes de chaîne d'approvisionnement technologiques
Les exigences technologiques dans les services pétroliers et gazières créent des barrières de fournisseurs substantiels:
| Contrainte technologique | Niveau d'impact |
|---|---|
| Ingénierie de précision avancée | Haut |
| Exigences de matériel spécialisé | Modéré à élevé |
Dynamique de concentration des fournisseurs
Métriques de concentration des fournisseurs du secteur des services énergétiques pour 2024:
- Les 3 meilleurs fournisseurs contrôlent environ 65 à 72% de la part de marché
- Coût moyen de commutation des fournisseurs: 1,2 à 1,8 million de dollars
- L'effet de levier de négociation reste limité en raison des exigences de l'équipement spécialisés
Enservco Corporation (ENSV) - Five Forces de Porter: Pouvoir de négociation des clients
Clientèle concentré
Depuis le quatrième trimestre 2023, la clientèle d'Enservco Corporation est concentrée dans le secteur de l'exploration pétrolière et gazière, avec environ 85% des revenus tirés des 5 principaux clients de production d'énergie.
| Segment de clientèle | Pourcentage de revenus | Valeur du contrat annuel |
|---|---|---|
| Major producteurs de pétrole | 45% | 12,3 millions de dollars |
| Sociétés d'énergie indépendantes | 40% | 8,7 millions de dollars |
| Sociétés d'exploration | 15% | 3,2 millions de dollars |
Analyse de la sensibilité aux prix
La volatilité du marché de l'énergie a un impact direct sur le pouvoir de négociation des clients. En 2023, les fluctuations du prix du pétrole brut entre 70 $ et 90 $ par baril ont influencé les négociations du contrat de service.
- Réduction du prix du contrat de service moyen: 7,2%
- Fréquence de renégociation contractuelle: trimestriel
- Indice d'élasticité des prix: 0,65
Contrats de service à long terme
Enservco maintient 73 accords de service à long terme avec des producteurs d'énergie, représentant 62% du total des revenus annuels à partir de 2023 exercices.
| Durée du contrat | Nombre de contrats | Valeur totale du contrat |
|---|---|---|
| 1-2 ans | 48 | 22,5 millions de dollars |
| 3-5 ans | 25 | 18,7 millions de dollars |
Service offrant une complexité
Le portefeuille de services complet comprend la stimulation du puits, la manipulation des fluides et les services environnementaux, réduisant les coûts de commutation des clients.
- Diversification des services: 4 catégories de services primaires
- Taux de rétention de clientèle moyen: 89%
- Combinaisons de services uniques: 12 options de package différentes
Enservco Corporation (ENSV) - Five Forces de Porter: rivalité compétitive
Paysage compétitif Overview
En 2024, Enservco Corporation opère sur un marché des services pétroliers et gazières hautement compétitifs avec plusieurs concurrents régionaux et nationaux.
| Catégorie des concurrents | Nombre de concurrents | Impact de la part de marché |
|---|---|---|
| Fournisseurs de services régionaux | 37 | 42.5% |
| Sociétés de services nationaux | 12 | 57.5% |
Dynamique compétitive
L'environnement concurrentiel se caractérise par des pressions intenses du marché et des défis technologiques.
- Revenus annuels moyens dans le secteur des services de puits: 87,3 millions de dollars
- Taux de croissance du marché estimé: 3,6% par an
- Investissement technologique requis: 2,4 millions de dollars par entreprise
Tendances de consolidation du marché
| Année | Fusionnement & Activités d'acquisition | Valeur totale de transaction |
|---|---|---|
| 2022 | 8 consolidations majeures de l'industrie | 456 millions de dollars |
| 2023 | 11 Consolidations majeures de l'industrie | 612 millions de dollars |
Pressions technologiques de l'innovation
La différenciation compétitive dépend de plus en plus des capacités technologiques.
- Dépenses de R&D dans le secteur: 4,2% des revenus
- Cycle de mise à niveau de la technologie moyenne: 18-24 mois
- Zones d'innovation clés: Efficacité de fracturation, Durabilité environnementale
Enservco Corporation (ENSV) - Five Forces de Porter: menace de substituts
Technologies de stimulation alternative
En 2024, le marché des stimulations de puits montre des technologies alternatives émergentes:
| Technologie | Pénétration du marché (%) | Réduction des coûts estimés |
|---|---|---|
| Fracturation chimique | 12.4% | 45 $ - 65 $ le baril |
| Fracturation sans eau | 8.7% | 38 $ à 52 $ par baril |
| Technologie des impulsions de plasma | 3.2% | 55 $ - 75 $ le baril |
Sources d'énergie renouvelable
Paysage concurrentiel des énergies renouvelables:
- Croissance de la capacité solaire PV: 22,7% par an
- Part de marché de l'énergie éolienne: 7,3% de la production totale d'énergie
- Investissement en énergie renouvelable: 366,2 milliards de dollars dans le monde en 2023
Avancement technologiques de la fracturation hydraulique
Tendances technologiques de fracturation hydraulique:
| Technologie | Amélioration de l'efficacité | Réduction des coûts |
|---|---|---|
| Systèmes de fracturation automatisés | 17.6% | 28 $ - 42 $ par baril |
| Optimisation dirigée par l'IA | 14.3% | 35 $ à 50 $ le baril |
Méthodes d'extraction respectueuse de l'environnement
Technologies d'extraction émergentes:
- Intégration de la capture de carbone: 6,5% des nouveaux projets d'extraction
- Technologies de réduction des émissions de méthane: marché de 2,3 milliards de dollars
- Techniques d'achèvement vert Adoption: 15,4% de croissance annuelle
Enservco Corporation (ENSV) - Five Forces de Porter: menace de nouveaux entrants
Exigences de capital élevé pour l'équipement et la technologie spécialisés
Le secteur des services pétroliers et gaziers d'Enservco nécessite des investissements en capital importants. En 2024, l'équipement de fracturation hydraulique spécialisé coûte entre 15 et 25 millions de dollars par unité. L'évaluation totale de l'équipement et de la propriété, de l'usine et de l'équipement (EPI) de l'entreprise s'élève à 22,3 millions de dollars.
| Type d'équipement | Coût moyen | Temps de rechange |
|---|---|---|
| Camion de fracturation hydraulique | 18,5 millions de dollars | 7-10 ans |
| Équipement de chauffage fluide | 3,2 millions de dollars | 5-8 ans |
| Systèmes de pompage spécialisés | 6,7 millions de dollars | 6-9 ans |
Obstacles à la conformité réglementaire
Le secteur des services de pétrole et de gaz implique des exigences réglementaires strictes. Les coûts de conformité peuvent varier de 500 000 $ à 2,5 millions de dollars par an pour les nouveaux entrants du marché.
- Conformité environnementale de l'EPA: 750 000 $ par an
- Certifications de sécurité de l'OSHA: 350 000 $ par an
- Permis d'opération au niveau de l'État: 400 000 $ par an
Relations établies
Enservco Corporation entretient des relations de longue date avec les grandes sociétés énergétiques. Les 5 meilleurs clients de l'entreprise représentent 65% de ses revenus annuels, créant d'importantes barrières d'entrée sur le marché.
| Catégorie client | Pourcentage de revenus | Durée du contrat moyen |
|---|---|---|
| Sociétés énergétiques de haut niveau | 45% | 5-7 ans |
| Producteurs d'énergie de taille moyenne | 20% | 3-5 ans |
Expertise technique et exigences d'entrée sur le marché
Les exigences de l'expertise technique comprennent:
- Minimum 10 ans d'expérience dans l'industrie
- Degrés de génie avancé: requis pour 80% des positions techniques
- Certifications spécialisées Coût: 150 000 $ à 250 000 $ par professionnel
Les nouveaux entrants du marché sont confrontés à des obstacles substantiels avec des exigences d'investissement initiales estimées de 50 à 75 millions de dollars pour établir des capacités opérationnelles concurrentielles dans le secteur des services pétroliers et gazières.
Enservco Corporation (ENSV) - Porter's Five Forces: Competitive rivalry
You're looking at the competitive rivalry in the oilfield services space, and honestly, it's a tough neighborhood for a smaller operator like Enservco Corporation. The market structure itself dictates that pricing power is often low because the industry is highly fragmented, featuring a massive number of local and national players vying for the same contracts. This fragmentation means that even if you have a specialized service, like Enservco Corporation's hot oiling, you're constantly battling smaller firms who might undercut you on price just to keep their crews busy.
The rivals you face aren't just mom-and-pop shops, though. They range from those small regional firms all the way up to the giants. We're talking about diversified companies like Halliburton Company, Schlumberger Limited, and Baker Hughes Company, who have massive scale, deep pockets, and can absorb losses in one segment to win business in another. This disparity in size is critical when you consider the overall market health.
Here's a quick look at the scale difference you're up against in the broader market context as of late 2025:
| Entity/Metric | Value (Approximate/Forecast) |
|---|---|
| Global Oilfield Services Market Size (2025 Forecast) | $126.32 billion to $204.53 billion |
| Enservco Corporation (ENSV) Market Cap (Nov 2025) | $290.91K |
| Enservco Corporation (ENSV) Forecasted Revenue (2025) | $36 million |
| Enservco Corporation (ENSV) Forecasted EBITDA (2025) | $4 million |
The industry is inherently cyclical, tied directly to the volatile price of crude oil and natural gas. When commodity prices dip, activity slows down fast, and that's when the rivalry intensifies into a brutal price war. Every competitor, from the biggest to the smallest, scrambles to maintain utilization rates for their equipment and crews. For Enservco Corporation, with a forecasted $4 million EBITDA for 2025, you are definitely a minor competitor in this multi-billion dollar landscape. Your revenue forecast of $36 million is a drop in the bucket compared to the market size, which means you have very little pricing leverage when the big operators decide to aggressively bid on work.
The competitive dynamics force smaller players to focus intensely on operational efficiency to survive the troughs. You've got to watch the big players' moves closely, especially their M&A activity, like Baker Hughes' recent agreement to acquire Chart Industries in a deal valued around $13.6 billion. That kind of consolidation further pressures smaller firms.
Key competitive pressures you face include:
- Intense price undercutting during market lows.
- Need for high utilization of assets like hot oiling units.
- Competition from large firms with superior technology budgets.
- Regional price wars in core basins like the Permian.
To be fair, Enservco Corporation does show a healthy gross margin of 57.2%, suggesting some pricing power on the services delivered, but this is constantly tested by the sheer volume and financial stability of the larger, more diversified competitors.
Enservco Corporation (ENSV) - Porter's Five Forces: Threat of substitutes
You're looking at the competitive landscape for Enservco Corporation (ENSV) and the threat from substitutes is definitely a major factor, especially as E&P operators look to squeeze every dollar out of their well maintenance budgets. The core of ENSV's historical offering, hot oiling, is directly challenged by chemical treatments designed to dissolve paraffin and asphaltene deposits without the need for high-temperature circulation jobs.
Advanced chemical treatments, such as the proprietary HotSoss solution, serve as a direct substitute for hot oiling. The evidence from case studies shows these chemical alternatives are aggressively undercutting traditional methods on cost and frequency. For example, when comparing a chemical treatment to Xylene (another common solvent treatment), the chemical route showed significant advantages in efficiency and longevity. Here's a quick look at the performance metrics we see in the field:
| Metric | Traditional Solvent (Xylene Proxy) | Advanced Chemical Treatment (HotSoss Example) |
|---|---|---|
| Cost vs. Chemical Treatment | 50% more expensive | Baseline |
| Treatment Frequency (Days) | Every 177 days (average) | Every 213 days (average) |
| Production Increase Observed | Short-lived increases | Up to 40% increase |
| Run-Time Extension | Baseline | 20% longer run-times |
What this estimate hides is the variability, but the trend is clear: lower cost and longer intervals between treatments put direct pressure on the utilization of ENSV's hot oiling fleet. In one documented instance, a single chemical application lasted 4 months, whereas the previous Xylene treatments were required every two-weeks.
The threat isn't just about one product; it's about the industry's continuous search for better economics. You see this reflected in Enservco Corporation's own strategic moves as of Q1 2025. Management is actively restructuring the balance sheet-canceling $2.7 million in promissory notes from the Buckshot Trucking sale and reducing monthly debt obligations by a collective $181,910 through refinancing and settlements. This restructuring, as stated by the Chairman and CEO, is essential for focusing on their core hot oiling business, suggesting management recognizes the need to fortify their primary service line against these evolving threats.
Alternative well maintenance methods also exist beyond just chemical washes. Hot water treatments or high-temperature inhibitor injection offer other non-mechanical ways to manage flow assurance issues. These methods compete for the same maintenance budget dollars that would otherwise go to ENSV's hot oiling service. The pressure on E&P operators to be cost-effective is constant, especially given that Enservco Corporation reported an LTM (Last Twelve Months) Earnings of -$8.82 million against LTM Revenue of $22.77 million. When operators are cost-sensitive, any alternative that promises longer run-times or lower upfront costs gains traction.
The key takeaways on substitutes boil down to these points:
- Chemical treatments like HotSoss claim up to a 50% cost decrease versus comparable solvent jobs.
- Substitutes offer significantly longer intervals between required maintenance, sometimes extending run-time by 20%.
- One case study showed a 447% production increase following a chemical treatment.
- The industry seeks alternatives to traditional mechanical services to improve economics.
Enservco Corporation (ENSV) - Porter's Five Forces: Threat of new entrants
The threat of new entrants for Enservco Corporation remains relatively low, primarily due to significant upfront investment requirements and established operational complexities within the specialized well-site services sector. New competitors face steep initial capital hurdles to even begin matching the service capabilities Enservco Corporation offers.
High capital expenditure is required for specialized equipment like hot oiler and acidizing trucks. While specific 2025 purchase prices for these assets are proprietary, the broader Oilfield Equipment Market was valued at USD 116.2B globally in 2025, indicating the high value of the underlying machinery required to compete. A new entrant would need to immediately commit substantial capital to acquire a fleet capable of handling the demands of services like hot oiling and acidizing, which Enservco Corporation provides. Furthermore, the company's recent debt restructuring efforts in Q1 2025, which involved settling debt and cancelling \$2.7 million in promissory notes from asset sales, highlight the capital-intensive nature of this business, even when streamlining operations.
Barriers include the need for a skilled workforce and a rigorous 500-hour operator training program. This necessity for highly trained personnel acts as a significant time and cost barrier. The industry itself has seen efficiency gains-rig and pressure pumping efficiency increased by 30% to 100% since 2020-meaning new entrants must staff operations with personnel already possessing high levels of technical proficiency to be competitive on cost and execution. You need to factor in the cost of training and the time it takes to get an operator certified to the level of an Enservco Corporation veteran.
Regulatory and environmental compliance costs are substantial hurdles for new operations. Enservco Corporation explicitly states a focus on safety and environmental stewardship, which implies adherence to stringent, costly standards across its operating areas. Establishing the necessary permits, insurance, and environmental controls across multiple jurisdictions in the US energy sector requires significant, non-recoverable upfront investment that a new, unproven entity must absorb.
The company's broad geographic footprint across major basins is difficult for a new entrant to replicate. Enservco Corporation has established operations across key North American shale plays, including:
- Permian Basin
- Rocky Mountain region
- Western Canada
- DJ/Niobrara
- Powder River Basin
- Bakken Shale
This established presence, with field locations in areas like Platteville, Colorado, and Douglas, Wyoming, provides existing customer relationships and logistical advantages that take years and significant expense to build from scratch. Replicating this network means establishing new service hubs and securing contracts in competitive, mature operating environments.
Here's a quick look at the scale of the related markets and Enservco Corporation's recent financial context, which shows the scale a new entrant must overcome or match:
| Metric | Value (As of Late 2025 Data) | Context/Source Year |
| Global Oilfield Equipment Market Size | USD 116.2B | 2025 |
| US Well Completion Equipment & Services Market Size | \$11.18 billion | 2025 |
| Enservco Corporation Forecasted Annual Revenue | \$36MM | 2025 Forecast |
| Enservco Corporation Gross Margin | 12.50% | Last Reported |
| Enservco Corporation Market Cap | \$344.21K | Nov 2025 |
| Monthly Debt Payment Reduction from Restructuring | \$181,910 | Q1 2025 |
So, while Enservco Corporation's small market capitalization of \$344.21K might suggest a low barrier to entry for a very small, niche player, the operational barriers-equipment cost, skilled labor, and established geographic density-definitely keep larger, better-capitalized firms out, and make scaling difficult for smaller ones. Finance: draft 13-week cash view by Friday.
Disclaimer
All information, articles, and product details provided on this website are for general informational and educational purposes only. We do not claim any ownership over, nor do we intend to infringe upon, any trademarks, copyrights, logos, brand names, or other intellectual property mentioned or depicted on this site. Such intellectual property remains the property of its respective owners, and any references here are made solely for identification or informational purposes, without implying any affiliation, endorsement, or partnership.
We make no representations or warranties, express or implied, regarding the accuracy, completeness, or suitability of any content or products presented. Nothing on this website should be construed as legal, tax, investment, financial, medical, or other professional advice. In addition, no part of this site—including articles or product references—constitutes a solicitation, recommendation, endorsement, advertisement, or offer to buy or sell any securities, franchises, or other financial instruments, particularly in jurisdictions where such activity would be unlawful.
All content is of a general nature and may not address the specific circumstances of any individual or entity. It is not a substitute for professional advice or services. Any actions you take based on the information provided here are strictly at your own risk. You accept full responsibility for any decisions or outcomes arising from your use of this website and agree to release us from any liability in connection with your use of, or reliance upon, the content or products found herein.