
|
Enservco Corporation (ENSV): 5 FORCES Analysis [Nov-2025 Updated] |
Fully Editable: Tailor To Your Needs In Excel Or Sheets
Professional Design: Trusted, Industry-Standard Templates
Investor-Approved Valuation Models
MAC/PC Compatible, Fully Unlocked
No Expertise Is Needed; Easy To Follow
Enservco Corporation (ENSV) Bundle
You're looking at a small-cap oilfield services firm, Enservco Corporation, right as they aim for $36 million in 2025 revenue, with a projected $4 million in EBITDA. Honestly, navigating this cyclical, capital-heavy sector means every competitive pressure matters, defintely so for a company this size. Before you decide on your next move, we need to map out exactly where the leverage sits-who holds the power with suppliers, who dictates price with customers, and how vulnerable they are to rivals and new tech. Let's break down the five forces to see the real battlefield for Enservco Corporation right now.
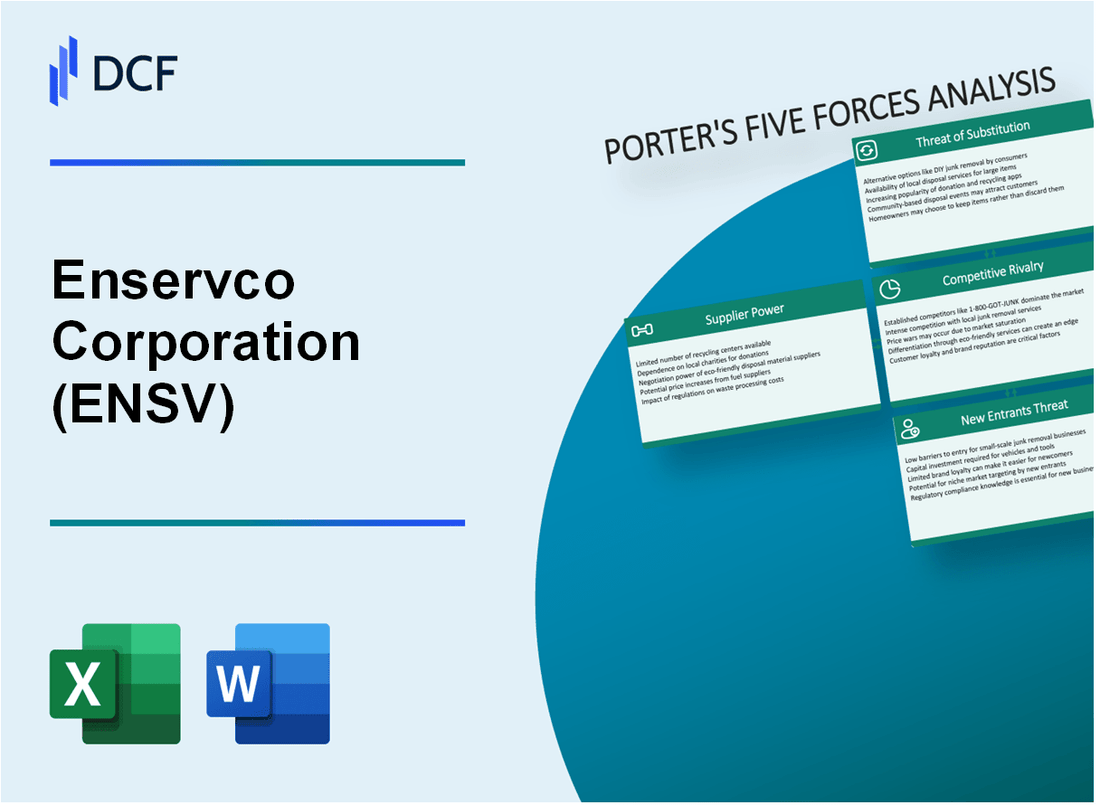
Enservco Corporation (ENSV) - Porter's Five Forces: Bargaining power of suppliers
The bargaining power of suppliers for Enservco Corporation (ENSV) is shaped by the specialized nature of its inputs and the company's own financial standing as of late 2025.
Specialized chemical suppliers for acidizing and paraffin inhibitors hold leverage. The broader specialty oilfield chemicals market was valued at an estimated $16.75 billion in 2025, with projections showing growth to $19.69 billion by 2030. This indicates a market where specialized, high-performance chemicals-like the inhibitors ENSV uses-are in sustained demand, giving those niche producers pricing power. Furthermore, the market trend shows a shift toward advanced, tailored chemical programs for complex reservoirs, meaning suppliers who can meet these specific technical requirements are less substitutable.
Reliance on major equipment manufacturers for specialized hot oiler trucks is a factor. While specific data on ENSV's truck procurement contracts is not public, the industry relies on a limited pool of heavy-duty equipment manufacturers. Any significant increase in the cost of chassis or specialized components directly translates to higher capital expenditure or operational costs for Enservco Corporation (ENSV) when acquiring or replacing its service fleet.
Fuel and maintenance costs for a large fleet are highly sensitive to market prices. For a company operating a fleet of hot oiling and acidizing trucks, these variable costs are a major component of the overall cost structure. General service fleet benchmarks for 2025 show that fuel costs alone represent about 60% of the operational cost per mile (CPM). Maintenance costs, while lower at an average of $0.06 per mile for service fleets, are subject to inflation in parts and labor.
Here's a quick look at how general 2025 fleet cost benchmarks translate to supplier/input sensitivity for a company like Enservco Corporation (ENSV):
| Cost Component | 2025 Benchmark Metric | Associated Supplier/Input Risk |
|---|---|---|
| Fuel | $0.15 per mile (CPM) | Crude oil/Diesel price volatility; limited supplier negotiation leverage. |
| Maintenance (Parts & Labor) | Average $0.06 per mile (CPM) | Inflation in parts (e.g., diesel oil changes up 23.7% in Q1 2025) and technician labor rates. |
| Total Ownership Cost (TCO) | Approx. $9,584 annually per vehicle | Pricing power of truck/equipment OEMs and financing costs. |
The company's weak financial position increases supplier risk perception. Suppliers are inherently wary of extending favorable terms or credit to a customer facing financial instability. Enservco Corporation (ENSV) demonstrated this vulnerability in early 2025, having failed to file its Form 10-K for fiscal year 2024, which led to a delisting notice from OTCQB by May 15, 2025. While the company did complete significant debt restructuring, including cancelling $2.7 million in promissory notes and reducing monthly debt obligations by $181,910 through refinancings, the ongoing reporting delays signal higher counterparty risk to chemical providers and equipment lessors.
This financial uncertainty translates into tangible supplier behaviors:
- Suppliers may demand shorter payment terms, such as Net 15 instead of Net 30.
- Credit limits for essential chemicals may be tightened.
- Less flexibility on pricing for non-contracted, spot-market chemical needs.
- Equipment manufacturers may require higher deposits or shorter lease terms.
Finance: draft 13-week cash view by Friday.
Enservco Corporation (ENSV) - Porter's Five Forces: Bargaining power of customers
You're looking at Enservco Corporation (ENSV) and wondering just how much sway its buyers have over its pricing and terms. That's a smart place to start, because in the oilfield services game, the customer often holds the cards.
First off, Enservco Corporation does a good job of spreading out its client base. They serve over 300 Exploration & Production (E&P) customers across the major U.S. basins. This diversification is key; it means that if one or two smaller operators hit a rough patch, it doesn't sink the whole ship. Still, this customer count includes the giants of the industry.
The customer list features large, sophisticated oil majors. These are companies with massive procurement departments, definitely. When you're dealing with an integrated major, they have the scale to push hard for price concessions on every contract. They know the market rates, and they know how to negotiate leverage. Honestly, it's a different conversation than what a small independent operator might have.
To give you a concrete sense of the scale difference you're dealing with, look at Enservco Corporation's own metrics. A major E&P customer might have annual revenues in the billions, making ENSV's financials look quite modest in comparison. Here's the quick math on ENSV's scale as of late 2025 estimates and recent filings:
| Metric | Value (Approx. Late 2025/Recent TTM) |
|---|---|
| Forecasted Annual Revenue (2025) | $36MM |
| Revenue (TTM as of Q3 2024) | $22.77M |
| Market Capitalization (Nov 2025) | $290,914 |
| Total Employees | 86 |
| Shares Outstanding | 58.18M |
Services like hot oiling are essential maintenance for well upkeep, which should give Enservco Corporation some pricing floor. But, to be fair, the procurement process for many of these services is often run on a bid-based system. This means that even for necessary work, customers solicit multiple quotes, forcing service providers to compete aggressively on price to win the job. If onboarding takes 14+ days, churn risk rises, but here the risk is price erosion before the contract is even signed.
The small size of Enservco Corporation, evidenced by a market cap around $290,914 and a 2025 revenue forecast of $36MM, relative to the major E&P customers it serves, severely limits its pricing power. You can't dictate terms when you are a small vendor to a giant. This dynamic means Enservco Corporation must focus on operational excellence and fleet modernization to win on value, not just price, because the buyers have plenty of alternatives.
The key takeaways on buyer power are:
- Customer count is over 300, which helps diversify, but...
- The customer mix includes large oil majors who negotiate hard.
- Essential services like hot oiling are subject to competitive, bid-based procurement.
- ENSV's small scale (Market Cap $290,914) versus customer scale creates inherent pricing pressure.
Finance: draft 13-week cash view by Friday.
Enservco Corporation (ENSV) - Porter's Five Forces: Competitive rivalry
You're looking at the competitive rivalry in the oilfield services space, and honestly, it's a tough neighborhood for a smaller operator like Enservco Corporation. The market structure itself dictates that pricing power is often low because the industry is highly fragmented, featuring a massive number of local and national players vying for the same contracts. This fragmentation means that even if you have a specialized service, like Enservco Corporation's hot oiling, you're constantly battling smaller firms who might undercut you on price just to keep their crews busy.
The rivals you face aren't just mom-and-pop shops, though. They range from those small regional firms all the way up to the giants. We're talking about diversified companies like Halliburton Company, Schlumberger Limited, and Baker Hughes Company, who have massive scale, deep pockets, and can absorb losses in one segment to win business in another. This disparity in size is critical when you consider the overall market health.
Here's a quick look at the scale difference you're up against in the broader market context as of late 2025:
| Entity/Metric | Value (Approximate/Forecast) |
|---|---|
| Global Oilfield Services Market Size (2025 Forecast) | $126.32 billion to $204.53 billion |
| Enservco Corporation (ENSV) Market Cap (Nov 2025) | $290.91K |
| Enservco Corporation (ENSV) Forecasted Revenue (2025) | $36 million |
| Enservco Corporation (ENSV) Forecasted EBITDA (2025) | $4 million |
The industry is inherently cyclical, tied directly to the volatile price of crude oil and natural gas. When commodity prices dip, activity slows down fast, and that's when the rivalry intensifies into a brutal price war. Every competitor, from the biggest to the smallest, scrambles to maintain utilization rates for their equipment and crews. For Enservco Corporation, with a forecasted $4 million EBITDA for 2025, you are definitely a minor competitor in this multi-billion dollar landscape. Your revenue forecast of $36 million is a drop in the bucket compared to the market size, which means you have very little pricing leverage when the big operators decide to aggressively bid on work.
The competitive dynamics force smaller players to focus intensely on operational efficiency to survive the troughs. You've got to watch the big players' moves closely, especially their M&A activity, like Baker Hughes' recent agreement to acquire Chart Industries in a deal valued around $13.6 billion. That kind of consolidation further pressures smaller firms.
Key competitive pressures you face include:
- Intense price undercutting during market lows.
- Need for high utilization of assets like hot oiling units.
- Competition from large firms with superior technology budgets.
- Regional price wars in core basins like the Permian.
To be fair, Enservco Corporation does show a healthy gross margin of 57.2%, suggesting some pricing power on the services delivered, but this is constantly tested by the sheer volume and financial stability of the larger, more diversified competitors.
Enservco Corporation (ENSV) - Porter's Five Forces: Threat of substitutes
You're looking at the competitive landscape for Enservco Corporation (ENSV) and the threat from substitutes is definitely a major factor, especially as E&P operators look to squeeze every dollar out of their well maintenance budgets. The core of ENSV's historical offering, hot oiling, is directly challenged by chemical treatments designed to dissolve paraffin and asphaltene deposits without the need for high-temperature circulation jobs.
Advanced chemical treatments, such as the proprietary HotSoss solution, serve as a direct substitute for hot oiling. The evidence from case studies shows these chemical alternatives are aggressively undercutting traditional methods on cost and frequency. For example, when comparing a chemical treatment to Xylene (another common solvent treatment), the chemical route showed significant advantages in efficiency and longevity. Here's a quick look at the performance metrics we see in the field:
| Metric | Traditional Solvent (Xylene Proxy) | Advanced Chemical Treatment (HotSoss Example) |
|---|---|---|
| Cost vs. Chemical Treatment | 50% more expensive | Baseline |
| Treatment Frequency (Days) | Every 177 days (average) | Every 213 days (average) |
| Production Increase Observed | Short-lived increases | Up to 40% increase |
| Run-Time Extension | Baseline | 20% longer run-times |
What this estimate hides is the variability, but the trend is clear: lower cost and longer intervals between treatments put direct pressure on the utilization of ENSV's hot oiling fleet. In one documented instance, a single chemical application lasted 4 months, whereas the previous Xylene treatments were required every two-weeks.
The threat isn't just about one product; it's about the industry's continuous search for better economics. You see this reflected in Enservco Corporation's own strategic moves as of Q1 2025. Management is actively restructuring the balance sheet-canceling $2.7 million in promissory notes from the Buckshot Trucking sale and reducing monthly debt obligations by a collective $181,910 through refinancing and settlements. This restructuring, as stated by the Chairman and CEO, is essential for focusing on their core hot oiling business, suggesting management recognizes the need to fortify their primary service line against these evolving threats.
Alternative well maintenance methods also exist beyond just chemical washes. Hot water treatments or high-temperature inhibitor injection offer other non-mechanical ways to manage flow assurance issues. These methods compete for the same maintenance budget dollars that would otherwise go to ENSV's hot oiling service. The pressure on E&P operators to be cost-effective is constant, especially given that Enservco Corporation reported an LTM (Last Twelve Months) Earnings of -$8.82 million against LTM Revenue of $22.77 million. When operators are cost-sensitive, any alternative that promises longer run-times or lower upfront costs gains traction.
The key takeaways on substitutes boil down to these points:
- Chemical treatments like HotSoss claim up to a 50% cost decrease versus comparable solvent jobs.
- Substitutes offer significantly longer intervals between required maintenance, sometimes extending run-time by 20%.
- One case study showed a 447% production increase following a chemical treatment.
- The industry seeks alternatives to traditional mechanical services to improve economics.
Enservco Corporation (ENSV) - Porter's Five Forces: Threat of new entrants
The threat of new entrants for Enservco Corporation remains relatively low, primarily due to significant upfront investment requirements and established operational complexities within the specialized well-site services sector. New competitors face steep initial capital hurdles to even begin matching the service capabilities Enservco Corporation offers.
High capital expenditure is required for specialized equipment like hot oiler and acidizing trucks. While specific 2025 purchase prices for these assets are proprietary, the broader Oilfield Equipment Market was valued at USD 116.2B globally in 2025, indicating the high value of the underlying machinery required to compete. A new entrant would need to immediately commit substantial capital to acquire a fleet capable of handling the demands of services like hot oiling and acidizing, which Enservco Corporation provides. Furthermore, the company's recent debt restructuring efforts in Q1 2025, which involved settling debt and cancelling \$2.7 million in promissory notes from asset sales, highlight the capital-intensive nature of this business, even when streamlining operations.
Barriers include the need for a skilled workforce and a rigorous 500-hour operator training program. This necessity for highly trained personnel acts as a significant time and cost barrier. The industry itself has seen efficiency gains-rig and pressure pumping efficiency increased by 30% to 100% since 2020-meaning new entrants must staff operations with personnel already possessing high levels of technical proficiency to be competitive on cost and execution. You need to factor in the cost of training and the time it takes to get an operator certified to the level of an Enservco Corporation veteran.
Regulatory and environmental compliance costs are substantial hurdles for new operations. Enservco Corporation explicitly states a focus on safety and environmental stewardship, which implies adherence to stringent, costly standards across its operating areas. Establishing the necessary permits, insurance, and environmental controls across multiple jurisdictions in the US energy sector requires significant, non-recoverable upfront investment that a new, unproven entity must absorb.
The company's broad geographic footprint across major basins is difficult for a new entrant to replicate. Enservco Corporation has established operations across key North American shale plays, including:
- Permian Basin
- Rocky Mountain region
- Western Canada
- DJ/Niobrara
- Powder River Basin
- Bakken Shale
This established presence, with field locations in areas like Platteville, Colorado, and Douglas, Wyoming, provides existing customer relationships and logistical advantages that take years and significant expense to build from scratch. Replicating this network means establishing new service hubs and securing contracts in competitive, mature operating environments.
Here's a quick look at the scale of the related markets and Enservco Corporation's recent financial context, which shows the scale a new entrant must overcome or match:
| Metric | Value (As of Late 2025 Data) | Context/Source Year |
| Global Oilfield Equipment Market Size | USD 116.2B | 2025 |
| US Well Completion Equipment & Services Market Size | \$11.18 billion | 2025 |
| Enservco Corporation Forecasted Annual Revenue | \$36MM | 2025 Forecast |
| Enservco Corporation Gross Margin | 12.50% | Last Reported |
| Enservco Corporation Market Cap | \$344.21K | Nov 2025 |
| Monthly Debt Payment Reduction from Restructuring | \$181,910 | Q1 2025 |
So, while Enservco Corporation's small market capitalization of \$344.21K might suggest a low barrier to entry for a very small, niche player, the operational barriers-equipment cost, skilled labor, and established geographic density-definitely keep larger, better-capitalized firms out, and make scaling difficult for smaller ones. Finance: draft 13-week cash view by Friday.
Disclaimer
All information, articles, and product details provided on this website are for general informational and educational purposes only. We do not claim any ownership over, nor do we intend to infringe upon, any trademarks, copyrights, logos, brand names, or other intellectual property mentioned or depicted on this site. Such intellectual property remains the property of its respective owners, and any references here are made solely for identification or informational purposes, without implying any affiliation, endorsement, or partnership.
We make no representations or warranties, express or implied, regarding the accuracy, completeness, or suitability of any content or products presented. Nothing on this website should be construed as legal, tax, investment, financial, medical, or other professional advice. In addition, no part of this site—including articles or product references—constitutes a solicitation, recommendation, endorsement, advertisement, or offer to buy or sell any securities, franchises, or other financial instruments, particularly in jurisdictions where such activity would be unlawful.
All content is of a general nature and may not address the specific circumstances of any individual or entity. It is not a substitute for professional advice or services. Any actions you take based on the information provided here are strictly at your own risk. You accept full responsibility for any decisions or outcomes arising from your use of this website and agree to release us from any liability in connection with your use of, or reliance upon, the content or products found herein.