
|
Empify, Inc. (EXFY) Évaluation DCF |
Entièrement Modifiable: Adapté À Vos Besoins Dans Excel Ou Sheets
Conception Professionnelle: Modèles Fiables Et Conformes Aux Normes Du Secteur
Pré-Construits Pour Une Utilisation Rapide Et Efficace
Compatible MAC/PC, entièrement débloqué
Aucune Expertise N'Est Requise; Facile À Suivre
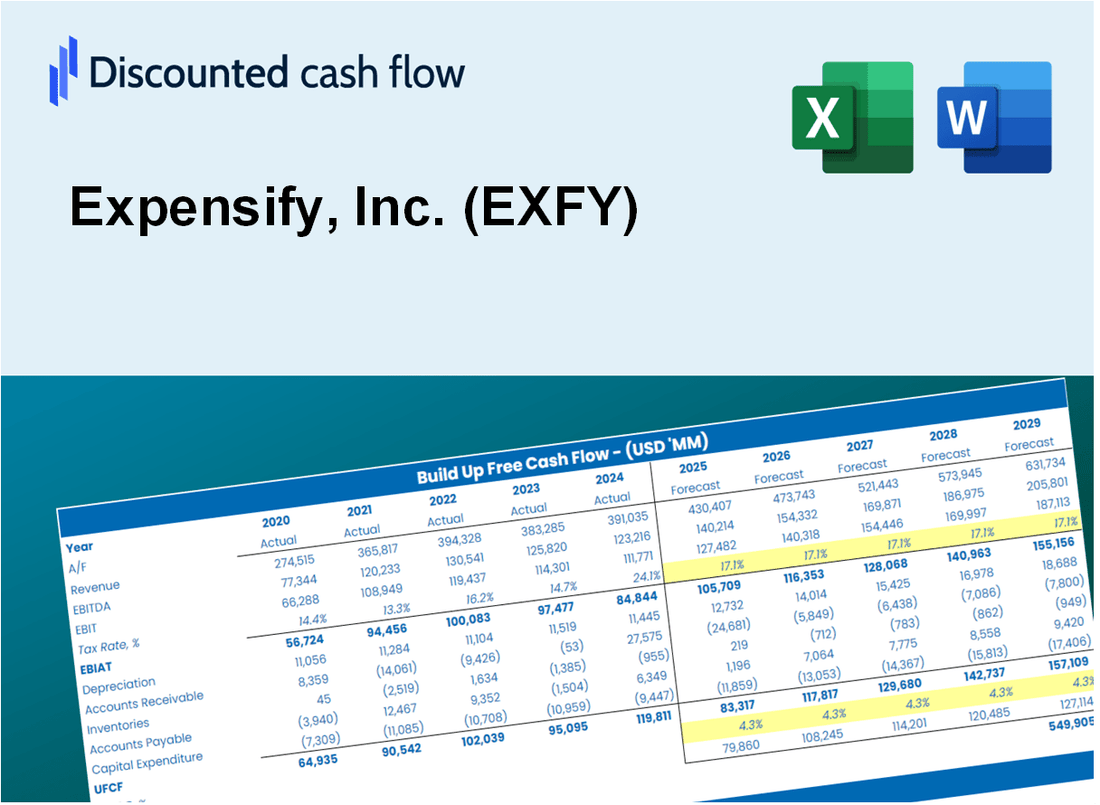
Expensify, Inc. (EXFY) Bundle
Améliorez vos stratégies d'investissement avec la calculatrice DCF de Tensify, Inc. (EXFY)! Plongez dans une dépense authentique des données financières, ajustez les prévisions et les dépenses de croissance et observez comment les modifications affectent la valeur intrinsèque de DePpensify, Inc. (exfy) en temps réel.
What You Will Receive
- Adjustable Expense Inputs: Modify parameters (growth %, margins, WACC) effortlessly to explore various scenarios.
- Comprehensive Financial Data: Expensify’s financial information pre-loaded to facilitate your analysis.
- Automated DCF Calculations: The template computes Net Present Value (NPV) and intrinsic value automatically.
- Tailored and Professional: A sleek Excel model that can be customized to suit your valuation requirements.
- Designed for Analysts and Investors: Perfect for assessing forecasts, confirming strategies, and optimizing efficiency.
Key Features
- Comprehensive Expense Tracking: Effortlessly manage and categorize expenses with our user-friendly interface.
- Real-Time Reporting: Generate detailed reports on-the-go to keep track of spending and budgeting.
- Seamless Integration: Connect with various accounting software and financial tools for streamlined workflows.
- Mobile Accessibility: Access your expense data anytime, anywhere with our mobile app.
- Designed for Teams: A collaborative platform suitable for businesses of all sizes, from startups to enterprises.
How It Works
- Step 1: Download the Excel file.
- Step 2: Review Expensify's pre-filled financial data and forecasts.
- Step 3: Modify key inputs such as revenue growth, WACC, and tax rates (highlighted cells).
- Step 4: Observe the DCF model update in real-time as you adjust assumptions.
- Step 5: Analyze the outputs and leverage the results for investment decisions.
Why Choose This Expense Tracker?
- User-Friendly Interface: Perfectly crafted for both novices and seasoned users.
- Customizable Features: Easily adjust settings to suit your expense management needs.
- Real-Time Insights: Monitor your spending patterns instantly as you input data.
- Preloaded Templates: Comes equipped with standard expense categories for quick setup.
- Relied Upon by Professionals: Trusted by businesses and individuals for effective budgeting.
Who Should Use Expensify, Inc. (EXFY)?
- Business Owners: Streamline expense management and gain insights into spending patterns.
- Finance Teams: Automate expense reporting and save time on manual processes.
- Accountants: Simplify the reconciliation process with accurate and organized expense data.
- Travel Managers: Enhance travel expense tracking and ensure compliance with company policies.
- Employees: Easily submit expenses and get reimbursed quickly with a user-friendly interface.
What the Template Contains
- Comprehensive DCF Model: Editable template with detailed valuation calculations for Expensify, Inc. (EXFY).
- Real-World Data: Expensify’s historical and projected financials preloaded for analysis.
- Customizable Parameters: Adjust WACC, growth rates, and tax assumptions to test various scenarios.
- Financial Statements: Full annual and quarterly breakdowns for deeper insights into Expensify's performance.
- Key Ratios: Built-in analysis for profitability, efficiency, and leverage specific to Expensify, Inc. (EXFY).
- Dashboard with Visual Outputs: Charts and tables providing clear, actionable results for stakeholders.
Disclaimer
All information, articles, and product details provided on this website are for general informational and educational purposes only. We do not claim any ownership over, nor do we intend to infringe upon, any trademarks, copyrights, logos, brand names, or other intellectual property mentioned or depicted on this site. Such intellectual property remains the property of its respective owners, and any references here are made solely for identification or informational purposes, without implying any affiliation, endorsement, or partnership.
We make no representations or warranties, express or implied, regarding the accuracy, completeness, or suitability of any content or products presented. Nothing on this website should be construed as legal, tax, investment, financial, medical, or other professional advice. In addition, no part of this site—including articles or product references—constitutes a solicitation, recommendation, endorsement, advertisement, or offer to buy or sell any securities, franchises, or other financial instruments, particularly in jurisdictions where such activity would be unlawful.
All content is of a general nature and may not address the specific circumstances of any individual or entity. It is not a substitute for professional advice or services. Any actions you take based on the information provided here are strictly at your own risk. You accept full responsibility for any decisions or outcomes arising from your use of this website and agree to release us from any liability in connection with your use of, or reliance upon, the content or products found herein.