
|
Ezfill Holdings Inc. (EZFL): 5 Analyse des forces [Jan-2025 MISE À JOUR] |
Entièrement Modifiable: Adapté À Vos Besoins Dans Excel Ou Sheets
Conception Professionnelle: Modèles Fiables Et Conformes Aux Normes Du Secteur
Pré-Construits Pour Une Utilisation Rapide Et Efficace
Compatible MAC/PC, entièrement débloqué
Aucune Expertise N'Est Requise; Facile À Suivre
EZFill Holdings Inc. (EZFL) Bundle
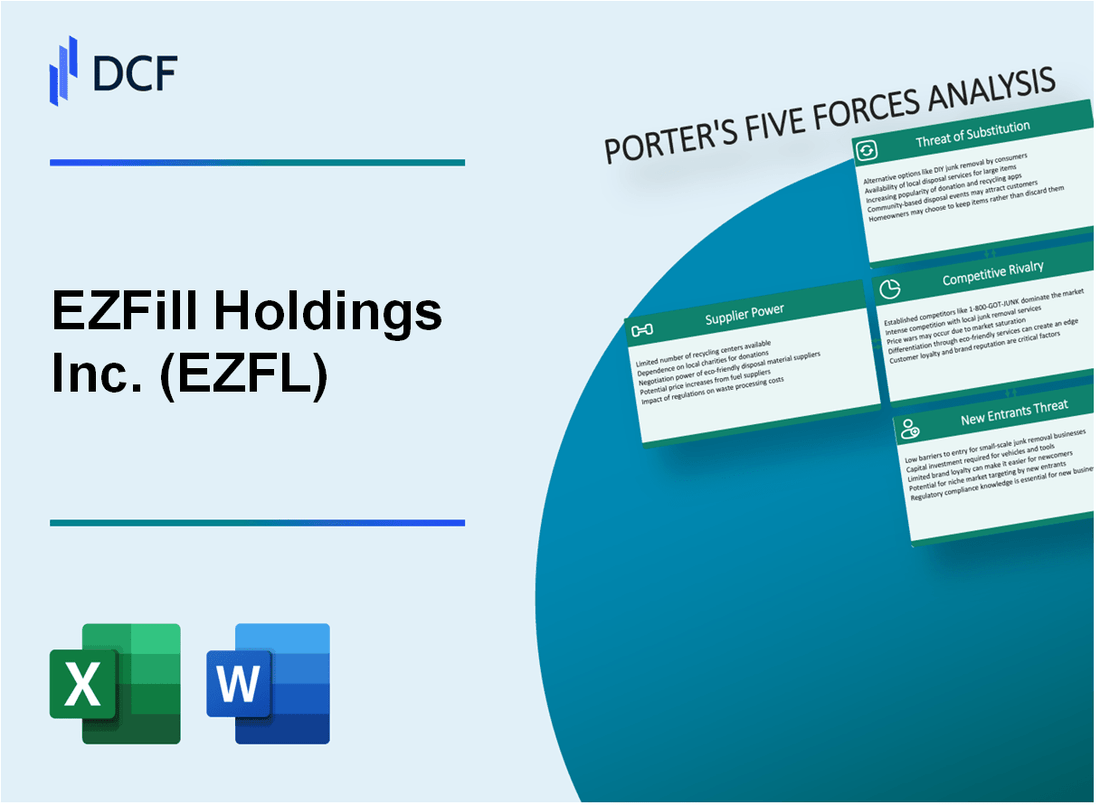
Dans le paysage d'alimentation mobile en évolution rapide, Ezfill Holdings Inc. (EZFL) navigue dans un écosystème complexe de défis et d'opportunités stratégiques. Alors que l'industrie se transforme avec les innovations technologiques et le changement de demande des consommateurs, la compréhension de la dynamique concurrentielle devient cruciale. Le cadre des Five Forces de Michael Porter offre une lentille pénétrante dans le positionnement du marché de l'EZFL, révélant une dynamique complexe de la puissance des fournisseurs, des relations avec les clients, de l'intensité concurrentielle, des menaces de substitution et des nouveaux entrants potentiels qui façonneront la trajectoire stratégique de l'entreprise en 2024 et au-delà.
Ezfill Holdings Inc. (EZFL) - Five Forces de Porter: Pouvoir de négociation des fournisseurs
Paysage des fournisseurs en technologie de ravitaillement mobile
Depuis 2024, Ezfill Holdings Inc. fait face à un marché des fournisseurs concentrés avec des alternatives limitées pour des équipements de ravitaillement mobiles spécialisés.
| Catégorie des fournisseurs | Nombre de fournisseurs | Concentration du marché |
|---|---|---|
| Fabricants de camions de carburant mobile | 3-4 fournisseurs spécialisés | Haute concentration (CR4> 70%) |
| Technologie de distribution de carburant | 2-3 fabricants principaux | Haute concentration de marché |
Dépendance de l'équipement et de la technologie
Les capacités opérationnelles d'Ezfill sont étroitement liées à un équipement de ravitaillement mobile spécialisé avec des exigences techniques spécifiques.
- Coûts de commutation estimés pour la technologie de ravitaillement mobile: 250 000 $ - 500 000 $ par conversion de camion
- Durée moyenne pour les achats de camions mobiles personnalisés: 6 à 9 mois
- Options limitées du fabricant pour une infrastructure de ravitaillement mobile spécialisée
Facteurs de levier des fournisseurs
| Facteur de levier | Niveau d'impact | Pourcentage estimé |
|---|---|---|
| Spécificité technologique | Haut | 75% d'exigences uniques |
| Complexité de la chaîne d'approvisionnement | Modéré | 60% de composants spécialisés |
Dynamique des coûts et des prix
Le pouvoir de tarification des fournisseurs montre une influence significative sur les dépenses opérationnelles d'Ezfill.
- Risque d'augmentation des prix potentiel: 15-25% par an
- Coût moyen de l'équipement par unité de carburant mobile: 350 000 $ - 450 000 $
- Pièces de maintenance et de remplacement annuelles: 75 000 $ - 125 000 $ par unité
Ezfill Holdings Inc. (EZFL) - Five Forces de Porter: Pouvoir de négociation des clients
Composition de la clientèle
Depuis le quatrième trimestre 2023, la clientèle d'Ezfill comprend:
- Consommateurs individuels: 68%
- Opérateurs de flotte commerciale: 32%
Analyse de la sensibilité aux prix
| Segment de clientèle | Niveau de sensibilité aux prix | Tolérance moyenne à la variance des prix |
|---|---|---|
| Consommateurs individuels | Haut | ± 0,15 $ par gallon |
| Flottes commerciales | Modéré | ± 0,08 $ par gallon |
Options de ravitaillement alternatifs
Alternatives de marché pour le ravitaillement mobile en 2024:
- Stations de gaz traditionnelles: 72%
- Services de carburant mobile: 18%
- Stations de charge électrique: 10%
Métriques de fidélisation de la clientèle
| Facteur de fidélité | Pourcentage |
|---|---|
| Tarif client répété | 42% |
| Satisfaction de la commodité du service | 76% |
| Commutation axée sur les prix | 58% |
Positionnement concurrentiel du marché
Part de marché mobile de ravitaillement: 5,6% à partir de 2024
Valeur de transaction moyenne: $42.37
Ezfill Holdings Inc. (EZFL) - Five Forces de Porter: rivalité compétitive
Paysage concurrentiel émergent dans la technologie de ravitaillement mobile
En 2024, le marché des technologies de ravitaillement mobile propose environ 15-20 concurrents actifs aux États-Unis. La taille du marché est estimée à 450 millions de dollars, avec un taux de croissance annuel composé projeté (TCAC) de 8,3%.
| Concurrent | Présence du marché | Technologie clé |
|---|---|---|
| Carburants de rappel | 7 zones métropolitaines | Alimentation basée sur l'application mobile |
| Filld | 4 zones métropolitaines | Livraison de carburant à la demande |
| Violet | 3 zones métropolitaines | Flotte des entreprises alimentant |
Présence de fournisseurs de services de ravitaillement régionaux et nationaux mobiles
Les fournisseurs de services mobiles de ravitaillement sont classés en segments régionaux et nationaux:
- Fournisseurs régionaux: Couvrir 1 à 3 zones métropolitaines
- Fournisseurs nationaux: opérez dans 5 à 10 régions métropolitaines
- Distribution des parts de marché: régional (60%), national (40%)
Différenciation par le biais de la technologie et de l'efficacité des services
Les différenciateurs technologiques clés comprennent:
| Fonctionnalité technologique | Taux d'adoption |
|---|---|
| Suivi GPS en temps réel | 78% |
| Intégration d'applications mobiles | 85% |
| Systèmes de facturation automatisés | 65% |
Dynamique de la fragmentation du marché
Métriques de concentration du marché:
- Les 3 meilleurs concurrents contrôlent environ 35% de part de marché
- 65% restants répartis entre les petits fournisseurs
- Revenus annuels moyens par entreprise de carburant mobile: 22,5 millions de dollars
Ezfill Holdings Inc. (EZFL) - Five Forces de Porter: Menace de substituts
Les stations-service traditionnelles comme principale alternative de ravitaillement
En 2024, il y a 145 000 stations-service aux États-Unis, ce qui représente 99,3% des infrastructures actuelles d'alimentation des véhicules.
| Type de carburant | Part de marché | Prix moyen par gallon |
|---|---|---|
| Essence ordinaire | 87.5% | $3.47 |
| Diesel | 12.5% | $4.15 |
Stations de recharge de véhicules électriques
Les bornes de recharge de véhicules électriques sont passées à 138 569 ports de chargement publics aux États-Unis en 2024.
- Stations de charge de niveau 2: 108 450 emplacements
- CC Fast Charging Stations: 30 119 emplacements
Services de livraison et d'alimentation à domicile
La taille du marché de la livraison de carburant mobile a atteint 2,3 milliards de dollars en 2024, avec 14 500 fournisseurs de services actifs à l'échelle nationale.
| Type de service | Pénétration du marché | Coût moyen de service |
|---|---|---|
| Livraison de carburant à la demande | 3.7% | 8,50 $ par livraison |
| Fournisseur domestique planifié | 1.2% | 6,75 $ par service |
Solutions de gestion de la flotte d'entreprise
Marché de la gestion des flotters d'entreprise d'une valeur de 37,4 milliards de dollars en 2024, avec des stratégies de carburant alternatives représentant 22,6% du total des approches de gestion de la flotte.
- Flotte de véhicules électriques: 18,3% des flottes d'entreprise
- Flotte de véhicules hybrides: 4,3% des flottes d'entreprise
Ezfill Holdings Inc. (EZFL) - Five Forces de Porter: Menace de nouveaux entrants
Exigences de capital initial pour l'infrastructure de ravitaillement mobile
Ezfill Holdings nécessite environ 3,5 millions à 5,2 millions de dollars d'investissement en capital initial pour le déploiement d'infrastructures de ravitaillement mobile. Les véhicules spécialisés de livraison de carburant mobile coûtent entre 150 000 $ et 250 000 $ par unité.
| Composant d'infrastructure | Plage de coûts estimés |
|---|---|
| Véhicules de livraison de carburant mobile | 150 000 $ - 250 000 $ par unité |
| Systèmes technologiques | 500 000 $ - 1,2 million de dollars |
| Conformité réglementaire | $250,000 - $750,000 |
Barrières technologiques et conformes réglementaires
La conformité réglementaire nécessite des investissements substantiels, avec des coûts estimés allant de 250 000 $ à 750 000 $ pour obtenir les permis nécessaires et respecter les normes de sécurité.
- Règlement sur le transport en carburant EPA Coût de conformité: 150 000 $ - 350 000 $
- Permis de ravitaillement mobile au niveau de l'État: 75 000 $ - 200 000 $
- Dépenses de certification de sécurité: 50 000 $ - 150 000 $
Exigences de connaissances spécialisées
La distribution de carburant mobile nécessite une expertise spécialisée avec des coûts de formation moyens de 75 000 $ à 125 000 $ par technicien.
| Catégorie d'expertise | Coût de formation |
|---|---|
| Formation technique | $50,000 - $85,000 |
| Certification de sécurité | $25,000 - $40,000 |
Potentiel de perturbation des startups technologiques
Les startups technologiques sont confrontées à des barrières d'entrée importantes avec des exigences d'investissement initiales estimées de 2,5 millions de dollars à 4,8 millions de dollars pour les plates-formes de distribution de carburant mobile.
- Coûts de développement logiciel: 500 000 $ - 1,2 million de dollars
- Développement d'applications mobiles: 250 000 $ - 600 000 $
- Frais de marketing initiaux: 200 000 $ - 500 000 $
EZFill Holdings Inc. (EZFL) - Porter's Five Forces: Competitive rivalry
Rivalry is high in the fragmented, rapidly growing mobile fuel market, projected to reach $5.84 billion in 2025.
You're looking at a space where brand recognition and operational scale matter a lot, but the market is still chopped up enough for aggressive competition to thrive. The market structure in 2025 is moderately concentrated, with the top players accounting for 50% to 60% of the total market share.
Key competitors like Booster Fuels and Filld compete directly for high-value corporate and fleet accounts. Honestly, the top three players-Booster Fuels, Filld, and Yoshi (prior to acquisition)-collectively held 55% of the market share as of early 2025, showing where the core battle for large contracts is fought. The Rest of Top 5, which includes EZFill Holdings Inc. and CAFU, held 15% of the market.
EZFill Holdings Inc. is one of the larger platforms, demonstrating scale advantages through significant recent revenue performance. For instance, revenue surged to $22.9 million in Q3 2025, which is up 232% year-over-year from $6.9 million in Q3 2024. To put that growth in perspective, the total revenue for the full fiscal year of 2024 was $27.8 million. The company's fleet expansion, reaching 99 trucks and entry into an 11th market by Q3 2025, also helped unlock volume-based supplier discounts, raising fuel margins from 8% to 11%.
The company's strategic M&A activity directly reduces competitor count and consolidates market share. The acquisition of Yoshi Mobility's fuel division, which closed on December 2, 2024, was a clear move to gain immediate scale. This transaction added 26 new trucks to the fleet, bringing the total to 66, and secured over 50 new commercial fleet accounts. This integration established EZFill Holdings Inc. in new markets like Los Angeles, San Francisco, Detroit, Houston, and Nashville.
Rivalry is intensified by EZFill Holdings Inc.'s critical cash position, which demands rapid market share gains to ensure operational runway. Cash at the end of Q3 2025 was only $650,000. The year-to-date operating cash usage through Q3 2025 was $14.1 million. This tight liquidity situation means that winning and securing high-value, long-term contracts, such as the two 28-year Power Purchase Agreements (PPAs) signed in Q3 2025 for California healthcare facilities, becomes an urgent necessity rather than just a strategic goal.
Here is a snapshot of the competitive landscape factors:
| Factor | Metric/Data Point | Value/Amount |
| Market Size (2025 Projection) | Mobile Fuel Delivery Market Valuation | USD $5.84 billion |
| Competitive Concentration (Top 3) | Market Share held by Booster Fuels, Filld, and Yoshi (pre-acquisition) | 55% |
| EZFill Holdings Inc. Scale (Q3 2025) | Revenue for Q3 2025 | $22.9 million |
| EZFill Holdings Inc. Scale (FY 2024) | Total Revenue for Full Year 2024 | $27.8 million |
| M&A Impact (Yoshi Acquisition) | New Trucks Added to Fleet | 26 |
| M&A Impact (Yoshi Acquisition) | New Commercial Fleet Accounts Added | Over 50 |
| Liquidity Risk (Q3 2025) | Cash Position at Quarter End | Approximately $650,000 |
| Operational Efficiency Gain | Fuel Margin Expansion (Q3 2025 vs. prior) | From 8% to 11% |
The pressure to convert growth into cash flow is evident when you look at the operational burn rate versus the cash on hand. The year-to-date operating cash usage through the first nine months of 2025 was $14.1 million.
EZFill Holdings Inc. (EZFL) - Porter's Five Forces: Threat of substitutes
Traditional gas stations remain the primary substitute, offering lower prices but sacrificing convenience and time. EZFill Holdings Inc.'s core service directly competes with the established physical fueling network. While the convenience of mobile delivery is a differentiator, the cost structure of the substitute is often lower at the pump.
The long-term shift to Electric Vehicles (EVs) and alternative fuels poses a significant, existential substitute threat. The U.S. EV adoption rate, measured as the share of EVs in total new sales, was only 7.5% in the first quarter of 2025, down from 8.7% in the fourth quarter of 2024. This contrasts sharply with global leaders; for instance, China accounted for nearly 50% of EV sales in Q1 2025. An estimated 85 million EVs are expected to be on the road by the end of 2025.
EZFill Holdings Inc. is addressing this threat by developing wireless EV charging and energy infrastructure solutions. The company's strategy includes developing wireless charging technology. The global wireless EV charging market is projected to grow from US$ 1,172.28 million in 2024 to around US$ 4,119.51 million by 2034, representing a CAGR of 13.64% during the forecast period from 2025 to 2034. EZFill Holdings Inc.'s delivery fleet size has expanded to 144 trucks.
The market for alternative fuels like biodiesel and renewable diesel is growing, pressuring the core gasoline/diesel service. The slow pace of EV adoption in the U.S. means that for the near- to medium-term, traditional fuel sources remain critical to the nation's fleet needs.
Here's a look at the competitive landscape metrics as of mid-2025:
| Metric | Value |
| U.S. EV Market Share (New Sales, Q1 2025) | 7.5% |
| China EV Market Share (New Sales, Q1 2025) | Nearly 50% |
| EU5 BEV Market Share (April 2025) | 15.3% |
| Average New Vehicle Price (US, March 2025) | $47,500 |
| Average Battery Electric Vehicle Price (US, March 2025) | $59,200 |
| EZFill Holdings Inc. Delivery Fleet Size (Late 2025) | 144 trucks |
| U.S. Public DC Fast Charger Ports (April 2025) | 52,700 |
The gap between EV charging infrastructure availability and demand is a key factor. S&P Global Mobility forecasts that domestic charging installations will need to quadruple over the 2022 - 2025 period to meet demand.
The cost differential between new EV and ICE vehicles still presents a barrier, with the average BEV price at $59,200 in March 2025 compared to the overall market average of $47,500. However, lifetime savings for an EV driver are estimated between $6,000 to $12,000.
- Residential Level 2 wireless charger installation cost range: $500 to $2,500.
- U.S. public charging ports (Level 2 and DCFC) total (April 2025): Over 204,900.
- EVs comprised 22% of light-duty vehicles sold in the U.S. in Q1 2025 when including hybrids.
- EZFill Holdings Inc. offers mobile fueling in consumer, commercial, and specialty verticals.
EZFill Holdings Inc. (EZFL) - Porter's Five Forces: Threat of new entrants
The threat of new entrants into the mobile fuel delivery sector for EZFill Holdings Inc. (EZFL)-which is now operating as NextNRG, Inc. as of February 14, 2025-is assessed as moderate to high. This is primarily due to the market's strong projected expansion, which naturally attracts attention from well-capitalized entities. The global mobile fuel delivery market is forecast to grow from USD 5.84 billion in 2025 to USD 11.93 billion by 2035, reflecting a robust compound annual growth rate (CAGR) of 7.4% over that period.
Capital requirements present a significant, though not insurmountable, barrier. To achieve the scale necessary for competitive pricing and reliable service, substantial investment in physical assets is required. For context, EZFill Holdings Inc. recently expanded its fleet to 144 trucks following the acquisition of 78 trucks from Shell, aiming for over $100 million in revenues in 2025. A new entrant aiming to replicate this scale would need to secure comparable capital for vehicle acquisition, storage infrastructure, and logistics technology.
Regulatory hurdles act as a meaningful barrier to entry, especially for smaller startups attempting to operate across state lines. Stringent fuel transport regulations create operational limits, with reports indicating that 31% of service providers face such constraints based on U.S. Department of Transportation (DOT) guidelines. Furthermore, specific compliance requirements add complexity and cost:
- Mobile fueling vehicles must carry a minimum 5 gallon (19 L) spill kit.
- Vehicles often require a fuel limit switch set to a maximum of 30 gallons (116 L) for dispensing.
- Permits are required from multiple authorities having jurisdiction, necessitating coordination across local, state, and federal levels.
Established oil majors are definitely a threat, not necessarily by starting new mobile operations from scratch, but by pivoting existing assets. While EZFill Holdings Inc. acquired a fleet from Shell, indicating a strategic exit from that specific operational segment for Shell, major players remain active in the broader mobile space. Companies like Shell plc (NYSE: SHEL) and BPCL are listed as key competitors in the mobile fuel delivery system market. BPCL, for instance, has introduced its own door-to-door fuel delivery service, leveraging its existing brand recognition and supply chain.
EZFill Holdings Inc.'s own strategic evolution raises the barrier for simple fuel delivery startups. The company's merger with NextNRG Holding Corp. and subsequent name change to NextNRG, Inc. signals a move beyond simple delivery into next-generation energy infrastructure. This new focus includes developing AI-driven Smart Microgrids, solar energy integration, and wireless EV charging. This integrated approach creates a high-barrier segment that simple fuel delivery startups, which lack the intellectual property and technology stack related to microgrids and AI energy management, cannot easily replicate.
| Metric | Data Point | Relevance to New Entrants |
|---|---|---|
| Market CAGR (2025-2035) | 7.4% | High growth attracts entrants, but scale is needed to compete. |
| Market Size (2025 Estimate) | USD 5.84 billion | Indicates significant current revenue pool. |
| EZFill Fleet Size (Post-Shell Acquisition) | 144 trucks | Sets a high benchmark for initial fleet capital outlay. |
| EZFill 2025 Revenue Forecast | Over $100 million | Shows the revenue potential achievable at scale. |
| Regulatory Operational Limits | 31% of providers face limits | Highlights the operational risk and compliance cost. |
| Required Spill Kit Capacity | Minimum 5 gallon (19 L) | Specific equipment cost and compliance detail. |
Disclaimer
All information, articles, and product details provided on this website are for general informational and educational purposes only. We do not claim any ownership over, nor do we intend to infringe upon, any trademarks, copyrights, logos, brand names, or other intellectual property mentioned or depicted on this site. Such intellectual property remains the property of its respective owners, and any references here are made solely for identification or informational purposes, without implying any affiliation, endorsement, or partnership.
We make no representations or warranties, express or implied, regarding the accuracy, completeness, or suitability of any content or products presented. Nothing on this website should be construed as legal, tax, investment, financial, medical, or other professional advice. In addition, no part of this site—including articles or product references—constitutes a solicitation, recommendation, endorsement, advertisement, or offer to buy or sell any securities, franchises, or other financial instruments, particularly in jurisdictions where such activity would be unlawful.
All content is of a general nature and may not address the specific circumstances of any individual or entity. It is not a substitute for professional advice or services. Any actions you take based on the information provided here are strictly at your own risk. You accept full responsibility for any decisions or outcomes arising from your use of this website and agree to release us from any liability in connection with your use of, or reliance upon, the content or products found herein.