
|
Ezfill Holdings Inc. (EZFL): 5 forças Análise [Jan-2025 Atualizada] |
Totalmente Editável: Adapte-Se Às Suas Necessidades No Excel Ou Planilhas
Design Profissional: Modelos Confiáveis E Padrão Da Indústria
Pré-Construídos Para Uso Rápido E Eficiente
Compatível com MAC/PC, totalmente desbloqueado
Não É Necessária Experiência; Fácil De Seguir
EZFill Holdings Inc. (EZFL) Bundle
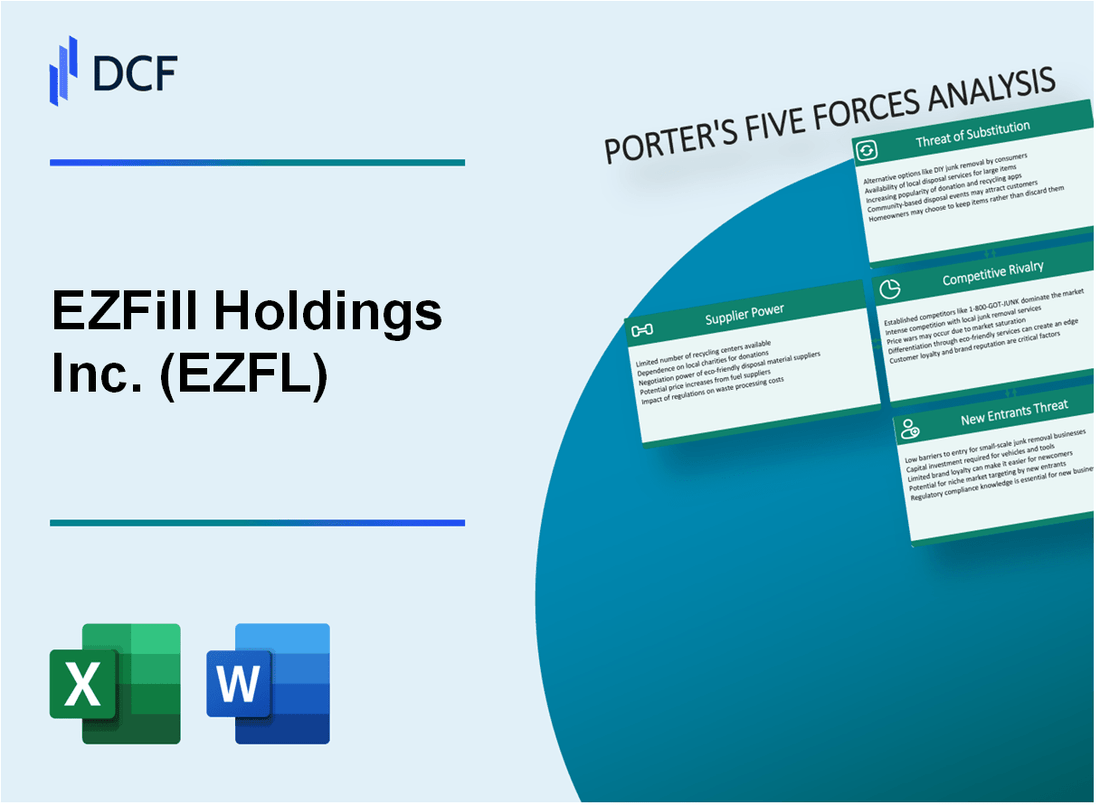
No cenário de abastecimento móvel em rápida evolução, a Ezfill Holdings Inc. (EZFL) navega em um complexo ecossistema de desafios e oportunidades estratégicas. À medida que a indústria se transforma com inovações tecnológicas e mudanças nas demandas do consumidor, entender a dinâmica competitiva se torna crucial. A estrutura das Five Forces de Michael Porter oferece uma lente penetrante no posicionamento do mercado da EZFL, revelando dinâmica complexa do poder do fornecedor, relacionamentos com clientes, intensidade competitiva, ameaças substitutas e possíveis novos participantes de mercado que moldarão a trajetória estratégica da empresa em 2024 e além.
Ezfill Holdings Inc. (EZFL) - As cinco forças de Porter: poder de barganha dos fornecedores
Cenário de fornecedores em tecnologia de abastecimento móvel
A partir de 2024, a Ezfill Holdings Inc. enfrenta um mercado de fornecedores concentrado com alternativas limitadas para equipamentos especializados de abastecimento móvel.
| Categoria de fornecedores | Número de fornecedores | Concentração de mercado |
|---|---|---|
| Fabricantes de caminhões de alimentação móvel | 3-4 fornecedores especializados | Alta concentração (CR4> 70%) |
| Tecnologia de distribuição de combustível | 2-3 Fabricantes primários | Alta concentração de mercado |
Equipamento e dependência tecnológica
Os recursos operacionais da Ezfill estão intimamente ligados a equipamentos especializados de abastecimento móvel com requisitos técnicos específicos.
- Custos estimados de troca para tecnologia de abastecimento móvel: US $ 250.000 - US $ 500.000 por conversão de caminhão
- Compra de caminhão de alimentação móvel personalizada de alimentação personalizada: 6-9 meses
- Opções limitadas do fabricante para infraestrutura especializada de abastecimento móvel
Fatores de alavancagem do fornecedor
| Fator de alavancagem | Nível de impacto | Porcentagem estimada |
|---|---|---|
| Especificidade da tecnologia | Alto | 75% requisitos exclusivos |
| Complexidade da cadeia de suprimentos | Moderado | 60% componentes especializados |
Dinâmica de custo e preços
O poder de precificação do fornecedor demonstra influência significativa nas despesas operacionais da Ezfill.
- Risco potencial de aumento de preço: 15-25% anualmente
- Custo médio do equipamento por unidade de abastecimento móvel: US $ 350.000 - US $ 450.000
- Peças anuais de manutenção e reposição: US $ 75.000 - US $ 125.000 por unidade
Ezfill Holdings Inc. (EZFL) - As cinco forças de Porter: poder de barganha dos clientes
Composição da base de clientes
A partir do quarto trimestre 2023, a base de clientes da Ezfill inclui:
- Consumidores individuais: 68%
- Operadores de frota comercial: 32%
Análise de sensibilidade ao preço
| Segmento de clientes | Nível de sensibilidade ao preço | Tolerância média à variação de preços |
|---|---|---|
| Consumidores individuais | Alto | ± US $ 0,15 por galão |
| Frotas comerciais | Moderado | ± US $ 0,08 por galão |
Opções alternativas de abastecimento
Alternativas de mercado para abastecimento móvel em 2024:
- Postos de gasolina tradicionais: 72%
- Serviços de abastecimento móvel: 18%
- Estações de carregamento elétrico: 10%
Métricas de fidelidade do cliente
| Fator de lealdade | Percentagem |
|---|---|
| Repetir a taxa de cliente | 42% |
| Satisfação da conveniência do serviço | 76% |
| Comutação orientada a preços | 58% |
Posicionamento competitivo de mercado
Participação de mercado de alimentação móvel: 5,6% a partir de 2024
Valor médio da transação: $42.37
Ezfill Holdings Inc. (EZFL) - As cinco forças de Porter: rivalidade competitiva
Cenário competitivo emergente na tecnologia de abastecimento móvel
Em 2024, o mercado de tecnologia de abastecimento móvel possui aproximadamente 15 a 20 concorrentes ativos nos Estados Unidos. O tamanho do mercado é estimado em US $ 450 milhões, com uma taxa de crescimento anual composta projetada (CAGR) de 8,3%.
| Concorrente | Presença de mercado | Tecnologia -chave |
|---|---|---|
| Fuels de reforço | 7 áreas metropolitanas | Abastecimento baseado em aplicativos móveis |
| Preenchimento | 4 áreas metropolitanas | Entrega de combustível sob demanda |
| Roxo | 3 áreas metropolitanas | Abastecimento de frota corporativa |
Presença de provedores de serviços de abastecimento móvel regional e nacional
Os provedores de serviços de abastecimento móvel são categorizados em segmentos regionais e nacionais:
- Fornecedores regionais: Cubra 1-3 áreas metropolitanas
- Provedores nacionais: operar em 5 a 10 regiões metropolitanas
- Distribuição de participação de mercado: regional (60%), nacional (40%)
Diferenciação através da tecnologia e eficiência de serviço
Os principais diferenciadores tecnológicos incluem:
| Recurso de tecnologia | Taxa de adoção |
|---|---|
| Rastreamento de GPS em tempo real | 78% |
| Integração de aplicativos móveis | 85% |
| Sistemas de cobrança automatizados | 65% |
Dinâmica de fragmentação do mercado
Métricas de concentração de mercado:
- Os 3 principais concorrentes controlam aproximadamente 35% de participação de mercado
- 65% restantes distribuídos entre fornecedores menores
- Receita média anual por empresa de abastecimento móvel: US $ 22,5 milhões
Ezfill Holdings Inc. (EZFL) - As cinco forças de Porter: ameaça de substitutos
Postos de gasolina tradicionais como alternativa de abastecimento primário
Em 2024, existem 145.000 postos de gasolina nos Estados Unidos, representando 99,3% da infraestrutura atual de abastecimento de veículos.
| Tipo de combustível | Quota de mercado | Preço médio por galão |
|---|---|---|
| Gasolina comum | 87.5% | $3.47 |
| Diesel | 12.5% | $4.15 |
Estações de carregamento de veículos elétricos
As estações de carregamento de veículos elétricos cresceram para 138.569 portos de cobrança pública nos Estados Unidos em 2024.
- Estações de carregamento de nível 2: 108.450 locais
- DC Estações de carregamento rápido: 30.119 locais
Serviços de entrega e abastecimento doméstico
O tamanho do mercado de entrega de combustível móvel atingiu US $ 2,3 bilhões em 2024, com 14.500 provedores de serviços ativos em todo o país.
| Tipo de serviço | Penetração de mercado | Custo médio de serviço |
|---|---|---|
| Entrega de combustível sob demanda | 3.7% | US $ 8,50 por entrega |
| Abastecimento doméstico programado | 1.2% | US $ 6,75 por serviço |
Soluções de gerenciamento de frotas corporativas
O mercado de gerenciamento de frotas corporativo, avaliado em US $ 37,4 bilhões em 2024, com estratégias alternativas de combustível representando 22,6% das abordagens totais de gerenciamento de frotas.
- Frota de veículos elétricos: 18,3% das frotas corporativas
- Frota de veículos híbridos: 4,3% das frotas corporativas
Ezfill Holdings Inc. (EZFL) - As cinco forças de Porter: ameaça de novos participantes
Requisitos de capital inicial para infraestrutura de abastecimento móvel
A Ezfill Holdings requer aproximadamente US $ 3,5 milhões a US $ 5,2 milhões em investimento inicial de capital para implantação de infraestrutura de abastecimento móvel. Os veículos especializados de entrega de combustível móvel custam entre US $ 150.000 e US $ 250.000 por unidade.
| Componente de infraestrutura | Faixa de custo estimada |
|---|---|
| Veículos de entrega de combustível móvel | US $ 150.000 - US $ 250.000 por unidade |
| Sistemas de tecnologia | $ 500.000 - US $ 1,2 milhão |
| Conformidade regulatória | $250,000 - $750,000 |
Barreiras de tecnologia e conformidade regulatória
A conformidade regulatória requer investimentos substanciais, com custos estimados que variam de US $ 250.000 a US $ 750.000 para obter as licenças necessárias e atender aos padrões de segurança.
- Regulamentos de transporte de combustível da EPA Custo de conformidade: US $ 150.000 - US $ 350.000
- Permissões de abastecimento móvel em nível estadual: US $ 75.000 - $ 200.000
- Despesas de certificação de segurança: US $ 50.000 - US $ 150.000
Requisitos de conhecimento especializados
A distribuição de combustível móvel requer experiência especializada com custos médios de treinamento de US $ 75.000 a US $ 125.000 por técnico.
| Categoria de especialização | Custo de treinamento |
|---|---|
| Treinamento técnico | $50,000 - $85,000 |
| Certificação de segurança | $25,000 - $40,000 |
Potencial de interrupção de inicialização de tecnologia
As startups de tecnologia enfrentam barreiras de entrada significativas com requisitos de investimento inicial estimados de US $ 2,5 milhões a US $ 4,8 milhões em plataformas de distribuição de combustível móvel.
- Custos de desenvolvimento de software: US $ 500.000 - US $ 1,2 milhão
- Desenvolvimento de aplicativos móveis: US $ 250.000 - US $ 600.000
- Despesas iniciais de marketing: US $ 200.000 - US $ 500.000
EZFill Holdings Inc. (EZFL) - Porter's Five Forces: Competitive rivalry
Rivalry is high in the fragmented, rapidly growing mobile fuel market, projected to reach $5.84 billion in 2025.
You're looking at a space where brand recognition and operational scale matter a lot, but the market is still chopped up enough for aggressive competition to thrive. The market structure in 2025 is moderately concentrated, with the top players accounting for 50% to 60% of the total market share.
Key competitors like Booster Fuels and Filld compete directly for high-value corporate and fleet accounts. Honestly, the top three players-Booster Fuels, Filld, and Yoshi (prior to acquisition)-collectively held 55% of the market share as of early 2025, showing where the core battle for large contracts is fought. The Rest of Top 5, which includes EZFill Holdings Inc. and CAFU, held 15% of the market.
EZFill Holdings Inc. is one of the larger platforms, demonstrating scale advantages through significant recent revenue performance. For instance, revenue surged to $22.9 million in Q3 2025, which is up 232% year-over-year from $6.9 million in Q3 2024. To put that growth in perspective, the total revenue for the full fiscal year of 2024 was $27.8 million. The company's fleet expansion, reaching 99 trucks and entry into an 11th market by Q3 2025, also helped unlock volume-based supplier discounts, raising fuel margins from 8% to 11%.
The company's strategic M&A activity directly reduces competitor count and consolidates market share. The acquisition of Yoshi Mobility's fuel division, which closed on December 2, 2024, was a clear move to gain immediate scale. This transaction added 26 new trucks to the fleet, bringing the total to 66, and secured over 50 new commercial fleet accounts. This integration established EZFill Holdings Inc. in new markets like Los Angeles, San Francisco, Detroit, Houston, and Nashville.
Rivalry is intensified by EZFill Holdings Inc.'s critical cash position, which demands rapid market share gains to ensure operational runway. Cash at the end of Q3 2025 was only $650,000. The year-to-date operating cash usage through Q3 2025 was $14.1 million. This tight liquidity situation means that winning and securing high-value, long-term contracts, such as the two 28-year Power Purchase Agreements (PPAs) signed in Q3 2025 for California healthcare facilities, becomes an urgent necessity rather than just a strategic goal.
Here is a snapshot of the competitive landscape factors:
| Factor | Metric/Data Point | Value/Amount |
| Market Size (2025 Projection) | Mobile Fuel Delivery Market Valuation | USD $5.84 billion |
| Competitive Concentration (Top 3) | Market Share held by Booster Fuels, Filld, and Yoshi (pre-acquisition) | 55% |
| EZFill Holdings Inc. Scale (Q3 2025) | Revenue for Q3 2025 | $22.9 million |
| EZFill Holdings Inc. Scale (FY 2024) | Total Revenue for Full Year 2024 | $27.8 million |
| M&A Impact (Yoshi Acquisition) | New Trucks Added to Fleet | 26 |
| M&A Impact (Yoshi Acquisition) | New Commercial Fleet Accounts Added | Over 50 |
| Liquidity Risk (Q3 2025) | Cash Position at Quarter End | Approximately $650,000 |
| Operational Efficiency Gain | Fuel Margin Expansion (Q3 2025 vs. prior) | From 8% to 11% |
The pressure to convert growth into cash flow is evident when you look at the operational burn rate versus the cash on hand. The year-to-date operating cash usage through the first nine months of 2025 was $14.1 million.
EZFill Holdings Inc. (EZFL) - Porter's Five Forces: Threat of substitutes
Traditional gas stations remain the primary substitute, offering lower prices but sacrificing convenience and time. EZFill Holdings Inc.'s core service directly competes with the established physical fueling network. While the convenience of mobile delivery is a differentiator, the cost structure of the substitute is often lower at the pump.
The long-term shift to Electric Vehicles (EVs) and alternative fuels poses a significant, existential substitute threat. The U.S. EV adoption rate, measured as the share of EVs in total new sales, was only 7.5% in the first quarter of 2025, down from 8.7% in the fourth quarter of 2024. This contrasts sharply with global leaders; for instance, China accounted for nearly 50% of EV sales in Q1 2025. An estimated 85 million EVs are expected to be on the road by the end of 2025.
EZFill Holdings Inc. is addressing this threat by developing wireless EV charging and energy infrastructure solutions. The company's strategy includes developing wireless charging technology. The global wireless EV charging market is projected to grow from US$ 1,172.28 million in 2024 to around US$ 4,119.51 million by 2034, representing a CAGR of 13.64% during the forecast period from 2025 to 2034. EZFill Holdings Inc.'s delivery fleet size has expanded to 144 trucks.
The market for alternative fuels like biodiesel and renewable diesel is growing, pressuring the core gasoline/diesel service. The slow pace of EV adoption in the U.S. means that for the near- to medium-term, traditional fuel sources remain critical to the nation's fleet needs.
Here's a look at the competitive landscape metrics as of mid-2025:
| Metric | Value |
| U.S. EV Market Share (New Sales, Q1 2025) | 7.5% |
| China EV Market Share (New Sales, Q1 2025) | Nearly 50% |
| EU5 BEV Market Share (April 2025) | 15.3% |
| Average New Vehicle Price (US, March 2025) | $47,500 |
| Average Battery Electric Vehicle Price (US, March 2025) | $59,200 |
| EZFill Holdings Inc. Delivery Fleet Size (Late 2025) | 144 trucks |
| U.S. Public DC Fast Charger Ports (April 2025) | 52,700 |
The gap between EV charging infrastructure availability and demand is a key factor. S&P Global Mobility forecasts that domestic charging installations will need to quadruple over the 2022 - 2025 period to meet demand.
The cost differential between new EV and ICE vehicles still presents a barrier, with the average BEV price at $59,200 in March 2025 compared to the overall market average of $47,500. However, lifetime savings for an EV driver are estimated between $6,000 to $12,000.
- Residential Level 2 wireless charger installation cost range: $500 to $2,500.
- U.S. public charging ports (Level 2 and DCFC) total (April 2025): Over 204,900.
- EVs comprised 22% of light-duty vehicles sold in the U.S. in Q1 2025 when including hybrids.
- EZFill Holdings Inc. offers mobile fueling in consumer, commercial, and specialty verticals.
EZFill Holdings Inc. (EZFL) - Porter's Five Forces: Threat of new entrants
The threat of new entrants into the mobile fuel delivery sector for EZFill Holdings Inc. (EZFL)-which is now operating as NextNRG, Inc. as of February 14, 2025-is assessed as moderate to high. This is primarily due to the market's strong projected expansion, which naturally attracts attention from well-capitalized entities. The global mobile fuel delivery market is forecast to grow from USD 5.84 billion in 2025 to USD 11.93 billion by 2035, reflecting a robust compound annual growth rate (CAGR) of 7.4% over that period.
Capital requirements present a significant, though not insurmountable, barrier. To achieve the scale necessary for competitive pricing and reliable service, substantial investment in physical assets is required. For context, EZFill Holdings Inc. recently expanded its fleet to 144 trucks following the acquisition of 78 trucks from Shell, aiming for over $100 million in revenues in 2025. A new entrant aiming to replicate this scale would need to secure comparable capital for vehicle acquisition, storage infrastructure, and logistics technology.
Regulatory hurdles act as a meaningful barrier to entry, especially for smaller startups attempting to operate across state lines. Stringent fuel transport regulations create operational limits, with reports indicating that 31% of service providers face such constraints based on U.S. Department of Transportation (DOT) guidelines. Furthermore, specific compliance requirements add complexity and cost:
- Mobile fueling vehicles must carry a minimum 5 gallon (19 L) spill kit.
- Vehicles often require a fuel limit switch set to a maximum of 30 gallons (116 L) for dispensing.
- Permits are required from multiple authorities having jurisdiction, necessitating coordination across local, state, and federal levels.
Established oil majors are definitely a threat, not necessarily by starting new mobile operations from scratch, but by pivoting existing assets. While EZFill Holdings Inc. acquired a fleet from Shell, indicating a strategic exit from that specific operational segment for Shell, major players remain active in the broader mobile space. Companies like Shell plc (NYSE: SHEL) and BPCL are listed as key competitors in the mobile fuel delivery system market. BPCL, for instance, has introduced its own door-to-door fuel delivery service, leveraging its existing brand recognition and supply chain.
EZFill Holdings Inc.'s own strategic evolution raises the barrier for simple fuel delivery startups. The company's merger with NextNRG Holding Corp. and subsequent name change to NextNRG, Inc. signals a move beyond simple delivery into next-generation energy infrastructure. This new focus includes developing AI-driven Smart Microgrids, solar energy integration, and wireless EV charging. This integrated approach creates a high-barrier segment that simple fuel delivery startups, which lack the intellectual property and technology stack related to microgrids and AI energy management, cannot easily replicate.
| Metric | Data Point | Relevance to New Entrants |
|---|---|---|
| Market CAGR (2025-2035) | 7.4% | High growth attracts entrants, but scale is needed to compete. |
| Market Size (2025 Estimate) | USD 5.84 billion | Indicates significant current revenue pool. |
| EZFill Fleet Size (Post-Shell Acquisition) | 144 trucks | Sets a high benchmark for initial fleet capital outlay. |
| EZFill 2025 Revenue Forecast | Over $100 million | Shows the revenue potential achievable at scale. |
| Regulatory Operational Limits | 31% of providers face limits | Highlights the operational risk and compliance cost. |
| Required Spill Kit Capacity | Minimum 5 gallon (19 L) | Specific equipment cost and compliance detail. |
Disclaimer
All information, articles, and product details provided on this website are for general informational and educational purposes only. We do not claim any ownership over, nor do we intend to infringe upon, any trademarks, copyrights, logos, brand names, or other intellectual property mentioned or depicted on this site. Such intellectual property remains the property of its respective owners, and any references here are made solely for identification or informational purposes, without implying any affiliation, endorsement, or partnership.
We make no representations or warranties, express or implied, regarding the accuracy, completeness, or suitability of any content or products presented. Nothing on this website should be construed as legal, tax, investment, financial, medical, or other professional advice. In addition, no part of this site—including articles or product references—constitutes a solicitation, recommendation, endorsement, advertisement, or offer to buy or sell any securities, franchises, or other financial instruments, particularly in jurisdictions where such activity would be unlawful.
All content is of a general nature and may not address the specific circumstances of any individual or entity. It is not a substitute for professional advice or services. Any actions you take based on the information provided here are strictly at your own risk. You accept full responsibility for any decisions or outcomes arising from your use of this website and agree to release us from any liability in connection with your use of, or reliance upon, the content or products found herein.