
|
Ezcorp, Inc. (EZPW) Évaluation DCF |
Entièrement Modifiable: Adapté À Vos Besoins Dans Excel Ou Sheets
Conception Professionnelle: Modèles Fiables Et Conformes Aux Normes Du Secteur
Pré-Construits Pour Une Utilisation Rapide Et Efficace
Compatible MAC/PC, entièrement débloqué
Aucune Expertise N'Est Requise; Facile À Suivre
EZCORP, Inc. (EZPW) Bundle
Simplifiez l'évaluation Ezcorp, Inc. (EZPW) avec cette calculatrice DCF personnalisable! Doté de véritables entrées financières Ezcorp et de prévisions réglables, vous pouvez tester des scénarios et découvrir la juste valeur d'Ezcorp en quelques minutes.
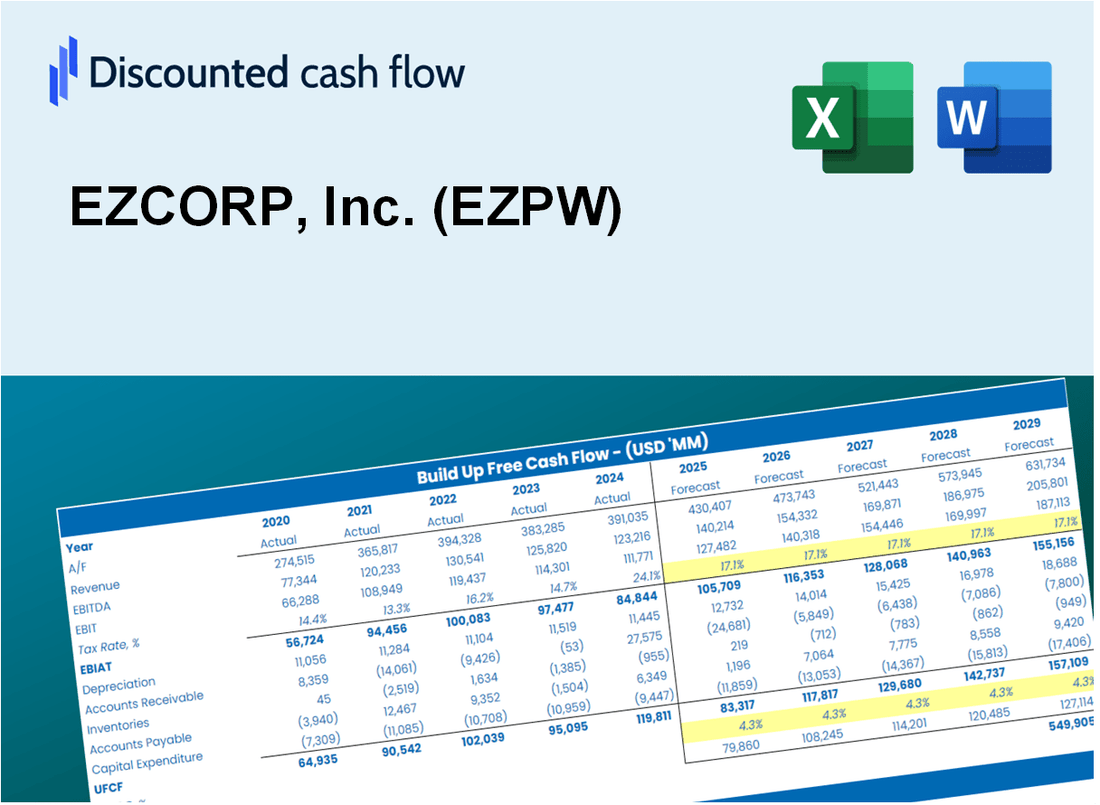
Discounted Cash Flow (DCF) - (USD MM)
| Year | AY1 2021 |
AY2 2022 |
AY3 2023 |
AY4 2024 |
AY5 2025 |
FY1 2026 |
FY2 2027 |
FY3 2028 |
FY4 2029 |
FY5 2030 |
|---|---|---|---|---|---|---|---|---|---|---|
| Revenue | 729.6 | 886.2 | 1,049.0 | 1,161.6 | 1,274.3 | 1,466.3 | 1,687.3 | 1,941.5 | 2,234.1 | 2,570.8 |
| Revenue Growth, % | 0 | 21.48 | 18.37 | 10.73 | 9.7 | 15.07 | 15.07 | 15.07 | 15.07 | 15.07 |
| EBITDA | 117.4 | 162.0 | 100.2 | 162.3 | 202.3 | 216.4 | 249.0 | 286.5 | 329.6 | 379.3 |
| EBITDA, % | 16.09 | 18.28 | 9.55 | 13.97 | 15.88 | 14.75 | 14.75 | 14.75 | 14.75 | 14.75 |
| Depreciation | 79.2 | 84.3 | 32.1 | 33.1 | 32.5 | 84.5 | 97.3 | 111.9 | 128.8 | 148.2 |
| Depreciation, % | 10.85 | 9.52 | 3.06 | 2.85 | 2.55 | 5.77 | 5.77 | 5.77 | 5.77 | 5.77 |
| EBIT | 38.2 | 77.7 | 68.1 | 129.2 | 169.8 | 131.8 | 151.7 | 174.5 | 200.8 | 231.1 |
| EBIT, % | 5.24 | 8.77 | 6.49 | 11.12 | 13.33 | 8.99 | 8.99 | 8.99 | 8.99 | 8.99 |
| Total Cash | 253.7 | 206.0 | 220.6 | 170.5 | 469.5 | 382.9 | 440.6 | 507.0 | 583.4 | 671.3 |
| Total Cash, percent | .0 | .0 | .0 | .0 | .0 | .0 | .0 | .0 | .0 | .0 |
| Account Receivables | 205.2 | 243.5 | 320.2 | 353.9 | 48.7 | 353.1 | 406.4 | 467.6 | 538.1 | 619.1 |
| Account Receivables, % | 28.13 | 27.47 | 30.52 | 30.47 | 3.82 | 24.08 | 24.08 | 24.08 | 24.08 | 24.08 |
| Inventories | 111.0 | 151.6 | 166.5 | 191.9 | 248.5 | 247.0 | 284.2 | 327.0 | 376.3 | 433.0 |
| Inventories, % | 15.21 | 17.11 | 15.87 | 16.52 | 19.5 | 16.84 | 16.84 | 16.84 | 16.84 | 16.84 |
| Accounts Payable | 22.5 | 24.1 | 23.0 | 20.9 | .0 | 28.7 | 33.0 | 38.0 | 43.7 | 50.3 |
| Accounts Payable, % | 3.08 | 2.71 | 2.19 | 1.79 | 0 | 1.96 | 1.96 | 1.96 | 1.96 | 1.96 |
| Capital Expenditure | -23.6 | -31.9 | -40.4 | -35.8 | .0 | -40.4 | -46.5 | -53.5 | -61.5 | -70.8 |
| Capital Expenditure, % | -3.24 | -3.6 | -3.86 | -3.08 | 0 | -2.75 | -2.75 | -2.75 | -2.75 | -2.75 |
| Tax Rate, % | 25.32 | 25.32 | 25.32 | 25.32 | 25.32 | 25.32 | 25.32 | 25.32 | 25.32 | 25.32 |
| EBITAT | 20.5 | 57.5 | 50.7 | 92.9 | 126.8 | 91.9 | 105.8 | 121.7 | 140.1 | 161.2 |
| Depreciation | ||||||||||
| Changes in Account Receivables | ||||||||||
| Changes in Inventories | ||||||||||
| Changes in Accounts Payable | ||||||||||
| Capital Expenditure | ||||||||||
| UFCF | -217.7 | 32.7 | -50.2 | 28.8 | 387.2 | -138.1 | 70.5 | 81.1 | 93.4 | 107.4 |
| WACC, % | 6.06 | 6.33 | 6.33 | 6.3 | 6.34 | 6.27 | 6.27 | 6.27 | 6.27 | 6.27 |
| PV UFCF | ||||||||||
| SUM PV UFCF | 152.5 | |||||||||
| Long Term Growth Rate, % | 2.00 | |||||||||
| Free cash flow (T + 1) | 110 | |||||||||
| Terminal Value | 2,566 | |||||||||
| Present Terminal Value | 1,893 | |||||||||
| Enterprise Value | 2,045 | |||||||||
| Net Debt | -224 | |||||||||
| Equity Value | 2,269 | |||||||||
| Diluted Shares Outstanding, MM | 83 | |||||||||
| Equity Value Per Share | 27.21 |
What You Will Get
- Pre-Filled Financial Model: EZCORP’s actual data allows for accurate DCF valuation.
- Full Forecast Control: Modify revenue growth, margins, WACC, and other essential drivers.
- Instant Calculations: Real-time updates ensure you see results as you adjust inputs.
- Investor-Ready Template: A polished Excel file crafted for high-quality valuation.
- Customizable and Reusable: Designed for adaptability, enabling repeated use for comprehensive forecasts.
Key Features
- Comprehensive DCF Calculator: Offers detailed unlevered and levered DCF valuation models tailored for EZCORP, Inc. (EZPW).
- WACC Calculator: Features a pre-built Weighted Average Cost of Capital sheet with adjustable inputs for personalized analysis.
- Customizable Forecast Assumptions: Adjust growth rates, capital expenditures, and discount rates to fit your analysis needs.
- Integrated Financial Ratios: Evaluate profitability, leverage, and efficiency ratios specifically for EZCORP, Inc. (EZPW).
- Interactive Dashboard and Charts: Visual representations present key valuation metrics for straightforward analysis.
How It Works
- Download the Template: Gain immediate access to the Excel-based EZCORP DCF Calculator.
- Input Your Assumptions: Modify the yellow-highlighted cells for growth rates, WACC, margins, and additional factors.
- Instant Calculations: The model automatically recalculates EZCORP’s intrinsic value.
- Test Scenarios: Experiment with various assumptions to assess potential changes in valuation.
- Analyze and Decide: Leverage the results to inform your investment or financial analysis.
Why Choose EZCORP, Inc. (EZPW)?
- Save Time: Instantly access financial insights without the hassle of building models from scratch.
- Enhance Accuracy: Dependable data and calculations minimize valuation errors.
- Completely Customizable: Adjust the framework to align with your unique assumptions and forecasts.
- User-Friendly: Intuitive visualizations and outputs facilitate straightforward analysis of results.
- Endorsed by Professionals: Crafted for experts who prioritize precision and functionality.
Who Should Use This Product?
- Investors: Assess EZCORP, Inc.’s (EZPW) fair value to inform your investment strategies.
- CFOs: Utilize a sophisticated DCF model for accurate financial reporting and analysis.
- Consultants: Easily customize the template for client valuation reports related to EZCORP, Inc. (EZPW).
- Entrepreneurs: Discover financial modeling practices employed by leading companies like EZCORP, Inc. (EZPW).
- Educators: Implement it as a resource to illustrate valuation techniques in the classroom.
What the Template Contains
- Historical Data: Includes EZCORP’s past financials and baseline forecasts.
- DCF and Levered DCF Models: Detailed templates to calculate EZCORP’s intrinsic value.
- WACC Sheet: Pre-built calculations for Weighted Average Cost of Capital.
- Editable Inputs: Modify key drivers like growth rates, EBITDA %, and CAPEX assumptions.
- Quarterly and Annual Statements: A complete breakdown of EZCORP’s financials.
- Interactive Dashboard: Visualize valuation results and projections dynamically.
Disclaimer
All information, articles, and product details provided on this website are for general informational and educational purposes only. We do not claim any ownership over, nor do we intend to infringe upon, any trademarks, copyrights, logos, brand names, or other intellectual property mentioned or depicted on this site. Such intellectual property remains the property of its respective owners, and any references here are made solely for identification or informational purposes, without implying any affiliation, endorsement, or partnership.
We make no representations or warranties, express or implied, regarding the accuracy, completeness, or suitability of any content or products presented. Nothing on this website should be construed as legal, tax, investment, financial, medical, or other professional advice. In addition, no part of this site—including articles or product references—constitutes a solicitation, recommendation, endorsement, advertisement, or offer to buy or sell any securities, franchises, or other financial instruments, particularly in jurisdictions where such activity would be unlawful.
All content is of a general nature and may not address the specific circumstances of any individual or entity. It is not a substitute for professional advice or services. Any actions you take based on the information provided here are strictly at your own risk. You accept full responsibility for any decisions or outcomes arising from your use of this website and agree to release us from any liability in connection with your use of, or reliance upon, the content or products found herein.