
|
FG Financial Group, Inc. (FGF) Évaluation DCF |
Entièrement Modifiable: Adapté À Vos Besoins Dans Excel Ou Sheets
Conception Professionnelle: Modèles Fiables Et Conformes Aux Normes Du Secteur
Pré-Construits Pour Une Utilisation Rapide Et Efficace
Compatible MAC/PC, entièrement débloqué
Aucune Expertise N'Est Requise; Facile À Suivre
FG Financial Group, Inc. (FGF) Bundle
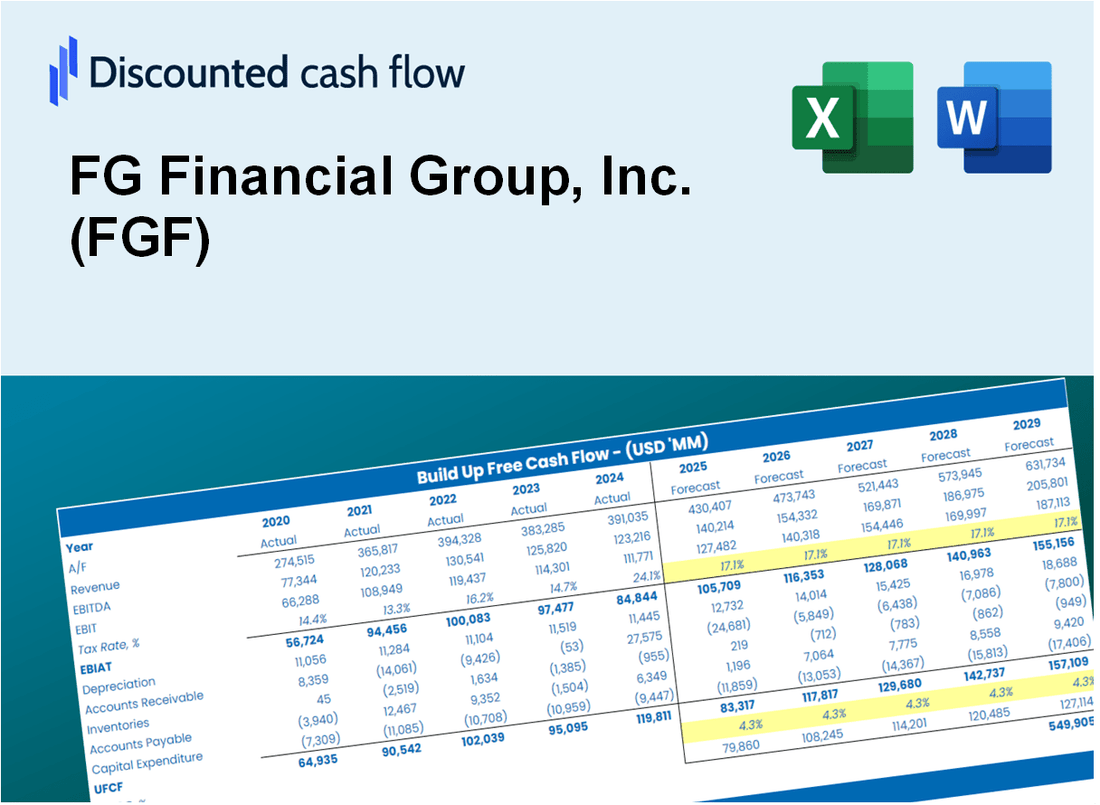
Que vous soyez un investisseur ou un analyste, cette calculatrice DCF (FGF) est votre outil essentiel pour une évaluation précise. Préchargé avec FG Financial Group, Inc. Real Data, vous pouvez ajuster les prévisions et observer les effets en temps réel.
What You Will Get
- Comprehensive FGF Financials: Access historical and projected data for precise valuation.
- Customizable Inputs: Adjust WACC, tax rates, revenue growth, and capital expenditures as needed.
- Real-Time Calculations: Intrinsic value and NPV are computed automatically.
- Scenario Analysis: Evaluate various scenarios to assess FG Financial Group, Inc.'s future performance.
- User-Friendly Interface: Designed for professionals while remaining accessible to newcomers.
Key Features
- Comprehensive Financial Analysis Tool: Offers in-depth unlevered and levered DCF valuation models tailored for FG Financial Group, Inc. (FGF).
- WACC Calculation Module: Features a pre-configured Weighted Average Cost of Capital sheet with adjustable parameters.
- Customizable Forecast Inputs: Easily alter growth projections, capital expenditures, and discount rates to suit your analysis.
- Integrated Financial Metrics: Evaluate profitability, leverage, and efficiency ratios specifically for FG Financial Group, Inc. (FGF).
- Interactive Dashboard and Visualizations: Graphical representations highlight essential valuation metrics for straightforward interpretation.
How It Works
- 1. Access the Template: Download and open the Excel file containing FG Financial Group, Inc.'s (FGF) preloaded data.
- 2. Modify Assumptions: Adjust key inputs such as growth rates, WACC, and capital expenditures.
- 3. Observe Results Instantly: The DCF model automatically calculates intrinsic value and NPV.
- 4. Explore Scenarios: Analyze various forecasts to evaluate different valuation outcomes.
- 5. Utilize with Assurance: Present expert valuation insights to back your decisions.
Why Choose FG Financial Group, Inc. ([Symbol])?
- Streamlined Process: Skip the hassle of building complex financial models – our tools are ready for immediate use.
- Enhanced Precision: Access to accurate financial data and robust formulas minimizes valuation errors.
- Completely Adaptable: Modify the model to suit your specific assumptions and forecasts.
- User-Friendly: Intuitive charts and outputs simplify the analysis of results.
- Endorsed by Professionals: Crafted for experts who prioritize accuracy and functionality.
Who Should Use FG Financial Group, Inc. (FGF)?
- Investors: Gain insights and make informed choices with our comprehensive financial services.
- Financial Analysts: Streamline your analysis with our robust tools designed for efficiency and accuracy.
- Consultants: Effortlessly tailor our solutions for client briefings and strategic reports.
- Finance Enthusiasts: Enhance your knowledge of financial strategies and market trends through our resources.
- Educators and Students: Utilize our offerings as a hands-on resource for finance education and practical applications.
What the Template Contains
- Operating and Balance Sheet Data: Pre-filled FG Financial Group, Inc. (FGF) historical data and forecasts, including revenue, EBITDA, EBIT, and capital expenditures.
- WACC Calculation: A dedicated sheet for Weighted Average Cost of Capital (WACC), including parameters like Beta, risk-free rate, and share price.
- DCF Valuation (Unlevered and Levered): Editable Discounted Cash Flow models showing intrinsic value with detailed calculations.
- Financial Statements: Pre-loaded financial statements (annual and quarterly) to support analysis.
- Key Ratios: Includes profitability, leverage, and efficiency ratios for FG Financial Group, Inc. (FGF).
- Dashboard and Charts: Visual summary of valuation outputs and assumptions to analyze results easily.
Disclaimer
All information, articles, and product details provided on this website are for general informational and educational purposes only. We do not claim any ownership over, nor do we intend to infringe upon, any trademarks, copyrights, logos, brand names, or other intellectual property mentioned or depicted on this site. Such intellectual property remains the property of its respective owners, and any references here are made solely for identification or informational purposes, without implying any affiliation, endorsement, or partnership.
We make no representations or warranties, express or implied, regarding the accuracy, completeness, or suitability of any content or products presented. Nothing on this website should be construed as legal, tax, investment, financial, medical, or other professional advice. In addition, no part of this site—including articles or product references—constitutes a solicitation, recommendation, endorsement, advertisement, or offer to buy or sell any securities, franchises, or other financial instruments, particularly in jurisdictions where such activity would be unlawful.
All content is of a general nature and may not address the specific circumstances of any individual or entity. It is not a substitute for professional advice or services. Any actions you take based on the information provided here are strictly at your own risk. You accept full responsibility for any decisions or outcomes arising from your use of this website and agree to release us from any liability in connection with your use of, or reliance upon, the content or products found herein.