
|
JFROG LTD. (FROG) Évaluation DCF |
Entièrement Modifiable: Adapté À Vos Besoins Dans Excel Ou Sheets
Conception Professionnelle: Modèles Fiables Et Conformes Aux Normes Du Secteur
Pré-Construits Pour Une Utilisation Rapide Et Efficace
Compatible MAC/PC, entièrement débloqué
Aucune Expertise N'Est Requise; Facile À Suivre
JFrog Ltd. (FROG) Bundle
Conçu pour la précision, notre calculatrice DCF (Frog) vous permet d'évaluer l'évaluation JFrog Ltd. à l'aide de données financières réelles, offrant une flexibilité complète pour modifier tous les paramètres clés pour des projections améliorées.
Discounted Cash Flow (DCF) - (USD MM)
| Year | AY1 2020 |
AY2 2021 |
AY3 2022 |
AY4 2023 |
AY5 2024 |
FY1 2025 |
FY2 2026 |
FY3 2027 |
FY4 2028 |
FY5 2029 |
|---|---|---|---|---|---|---|---|---|---|---|
| Revenue | 150.8 | 206.7 | 280.0 | 349.9 | 428.5 | 557.0 | 724.0 | 941.0 | 1,223.2 | 1,589.9 |
| Revenue Growth, % | 0 | 37.03 | 35.49 | 24.94 | 22.47 | 29.98 | 29.98 | 29.98 | 29.98 | 29.98 |
| EBITDA | -8.5 | -52.8 | -62.7 | -39.2 | -44.4 | -83.7 | -108.8 | -141.4 | -183.8 | -238.9 |
| EBITDA, % | -5.63 | -25.53 | -22.4 | -11.21 | -10.35 | -15.02 | -15.02 | -15.02 | -15.02 | -15.02 |
| Depreciation | 3.7 | 14.9 | 22.0 | 15.3 | 21.5 | 29.9 | 38.9 | 50.5 | 65.7 | 85.4 |
| Depreciation, % | 2.43 | 7.19 | 7.86 | 4.37 | 5.01 | 5.37 | 5.37 | 5.37 | 5.37 | 5.37 |
| EBIT | -12.1 | -67.6 | -84.7 | -54.5 | -65.8 | -113.6 | -147.7 | -191.9 | -249.5 | -324.3 |
| EBIT, % | -8.05 | -32.72 | -30.26 | -15.58 | -15.36 | -20.4 | -20.4 | -20.4 | -20.4 | -20.4 |
| Total Cash | 598.1 | 421.1 | 443.2 | 545.0 | 522.0 | 557.0 | 724.0 | 941.0 | 1,223.2 | 1,589.9 |
| Total Cash, percent | .0 | .0 | .0 | .0 | .0 | .0 | .0 | .0 | .0 | .0 |
| Account Receivables | 37.0 | 50.5 | 62.1 | 76.4 | 90.7 | 127.2 | 165.3 | 214.9 | 279.3 | 363.1 |
| Account Receivables, % | 24.56 | 24.43 | 22.18 | 21.85 | 21.17 | 22.84 | 22.84 | 22.84 | 22.84 | 22.84 |
| Inventories | .0 | .0 | .0 | .0 | .0 | .0 | .0 | .0 | .0 | .0 |
| Inventories, % | 0 | 0 | 0 | 0 | 0 | 0 | 0 | 0 | 0 | 0 |
| Accounts Payable | 9.9 | 10.9 | 14.9 | 17.0 | 10.6 | 27.3 | 35.4 | 46.1 | 59.9 | 77.8 |
| Accounts Payable, % | 6.57 | 5.26 | 5.31 | 4.85 | 2.49 | 4.89 | 4.89 | 4.89 | 4.89 | 4.89 |
| Capital Expenditure | -3.5 | -4.8 | -4.6 | -2.0 | -3.1 | -8.5 | -11.0 | -14.3 | -18.7 | -24.2 |
| Capital Expenditure, % | -2.34 | -2.34 | -1.65 | -0.56647 | -0.73351 | -1.52 | -1.52 | -1.52 | -1.52 | -1.52 |
| Tax Rate, % | -5.19 | -5.19 | -5.19 | -5.19 | -5.19 | -5.19 | -5.19 | -5.19 | -5.19 | -5.19 |
| EBITAT | -9.4 | -64.2 | -90.2 | -61.3 | -69.2 | -107.3 | -139.5 | -181.3 | -235.7 | -306.3 |
| Depreciation | ||||||||||
| Changes in Account Receivables | ||||||||||
| Changes in Inventories | ||||||||||
| Changes in Accounts Payable | ||||||||||
| Capital Expenditure | ||||||||||
| UFCF | -36.4 | -66.7 | -80.4 | -60.2 | -71.5 | -105.8 | -141.6 | -184.1 | -239.3 | -311.0 |
| WACC, % | 8.68 | 8.69 | 8.69 | 8.69 | 8.69 | 8.69 | 8.69 | 8.69 | 8.69 | 8.69 |
| PV UFCF | ||||||||||
| SUM PV UFCF | -737.1 | |||||||||
| Long Term Growth Rate, % | 2.00 | |||||||||
| Free cash flow (T + 1) | -317 | |||||||||
| Terminal Value | -4,745 | |||||||||
| Present Terminal Value | -3,129 | |||||||||
| Enterprise Value | -3,866 | |||||||||
| Net Debt | -36 | |||||||||
| Equity Value | -3,830 | |||||||||
| Diluted Shares Outstanding, MM | 110 | |||||||||
| Equity Value Per Share | -34.92 |
What You Will Get
- Editable Excel Template: A fully customizable Excel-based DCF Calculator featuring pre-filled real JFrog Ltd. (FROG) financials.
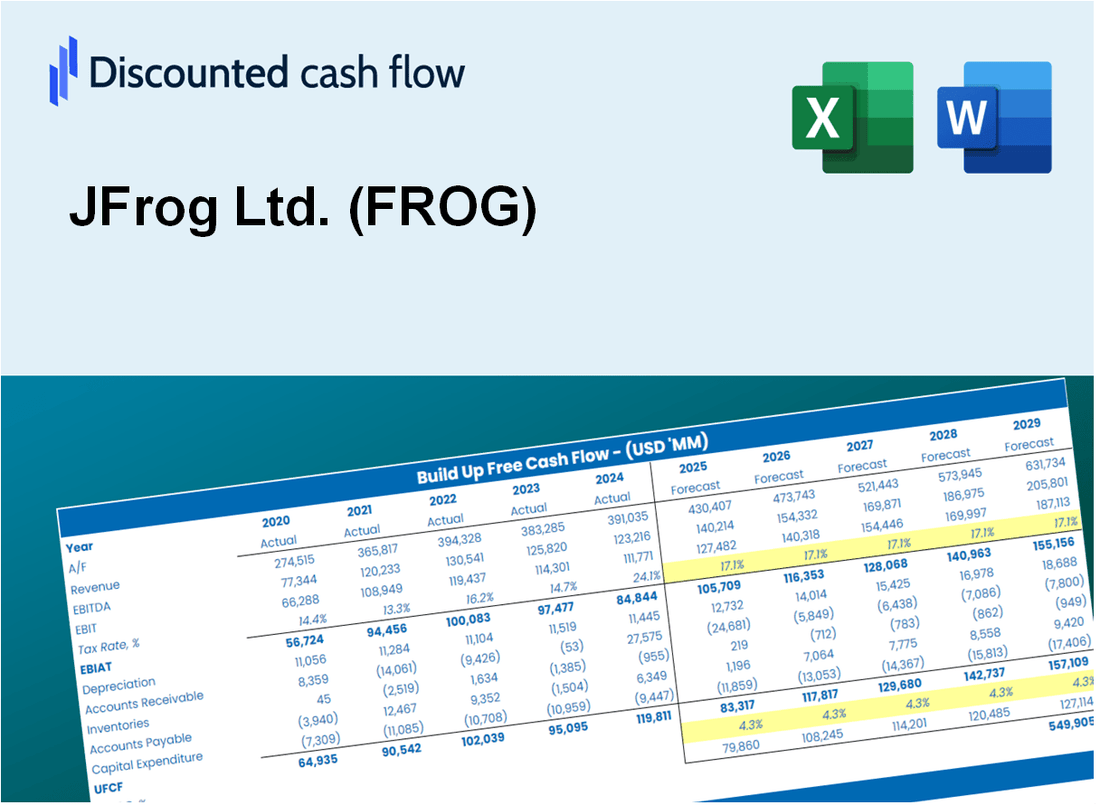
- Real-World Data: Historical data and forward-looking estimates (highlighted in the yellow cells).
- Forecast Flexibility: Adjust forecast assumptions such as revenue growth, EBITDA %, and WACC.
- Automatic Calculations: Instantly observe the effects of your inputs on JFrog Ltd.'s (FROG) valuation.
- Professional Tool: Designed for investors, CFOs, consultants, and financial analysts.
- User-Friendly Design: Organized for clarity and ease of use, complete with step-by-step instructions.
Key Features
- Accurate JFrog Financials: Gain access to reliable pre-loaded historical data and future forecasts.
- Tailorable Forecast Parameters: Modify highlighted fields such as WACC, growth rates, and profit margins.
- Real-Time Calculations: Automatic updates for DCF, Net Present Value (NPV), and cash flow assessments.
- Interactive Dashboard: User-friendly charts and summaries to help visualize your valuation findings.
- Designed for All Users: An intuitive layout suitable for investors, CFOs, and consultants alike.
How It Works
- Step 1: Download the prebuilt Excel template featuring JFrog Ltd.'s (FROG) data.
- Step 2: Navigate through the pre-filled sheets to grasp the essential metrics.
- Step 3: Modify forecasts and assumptions in the editable yellow cells (WACC, growth, margins).
- Step 4: Instantly view updated results, including JFrog Ltd.'s (FROG) intrinsic value.
- Step 5: Make well-informed investment choices or create reports based on the outputs.
Why Choose JFrog Ltd. (FROG) Calculator?
- All-in-One Solution: Features DCF, WACC, and financial ratio analyses tailored for JFrog Ltd.
- Flexible Inputs: Modify yellow-highlighted fields to explore different financial scenarios.
- In-Depth Analysis: Automatically computes JFrog's intrinsic value and Net Present Value.
- Preloaded Information: Contains historical and projected data for precise calculations.
- Expert-Level Tool: Perfect for financial analysts, investors, and consultants focusing on JFrog Ltd.
Who Should Use This Product?
- Professional Investors: Develop comprehensive and accurate valuation models for analyzing JFrog Ltd. (FROG) in their portfolios.
- Corporate Finance Teams: Evaluate valuation scenarios to inform strategic decisions within their organizations.
- Consultants and Advisors: Deliver precise valuation insights for clients interested in JFrog Ltd. (FROG) stock.
- Students and Educators: Utilize real-time data to enhance learning and practice in financial modeling.
- Tech Enthusiasts: Gain insights into how technology companies like JFrog Ltd. (FROG) are valued in the marketplace.
What the JFrog Template Contains
- Historical Data: Includes JFrog’s past financials and baseline forecasts.
- DCF and Levered DCF Models: Detailed templates to calculate JFrog’s intrinsic value.
- WACC Sheet: Pre-built calculations for Weighted Average Cost of Capital.
- Editable Inputs: Modify key drivers like growth rates, EBITDA %, and CAPEX assumptions.
- Quarterly and Annual Statements: A complete breakdown of JFrog’s financials.
- Interactive Dashboard: Visualize valuation results and projections dynamically.
Disclaimer
All information, articles, and product details provided on this website are for general informational and educational purposes only. We do not claim any ownership over, nor do we intend to infringe upon, any trademarks, copyrights, logos, brand names, or other intellectual property mentioned or depicted on this site. Such intellectual property remains the property of its respective owners, and any references here are made solely for identification or informational purposes, without implying any affiliation, endorsement, or partnership.
We make no representations or warranties, express or implied, regarding the accuracy, completeness, or suitability of any content or products presented. Nothing on this website should be construed as legal, tax, investment, financial, medical, or other professional advice. In addition, no part of this site—including articles or product references—constitutes a solicitation, recommendation, endorsement, advertisement, or offer to buy or sell any securities, franchises, or other financial instruments, particularly in jurisdictions where such activity would be unlawful.
All content is of a general nature and may not address the specific circumstances of any individual or entity. It is not a substitute for professional advice or services. Any actions you take based on the information provided here are strictly at your own risk. You accept full responsibility for any decisions or outcomes arising from your use of this website and agree to release us from any liability in connection with your use of, or reliance upon, the content or products found herein.