
|
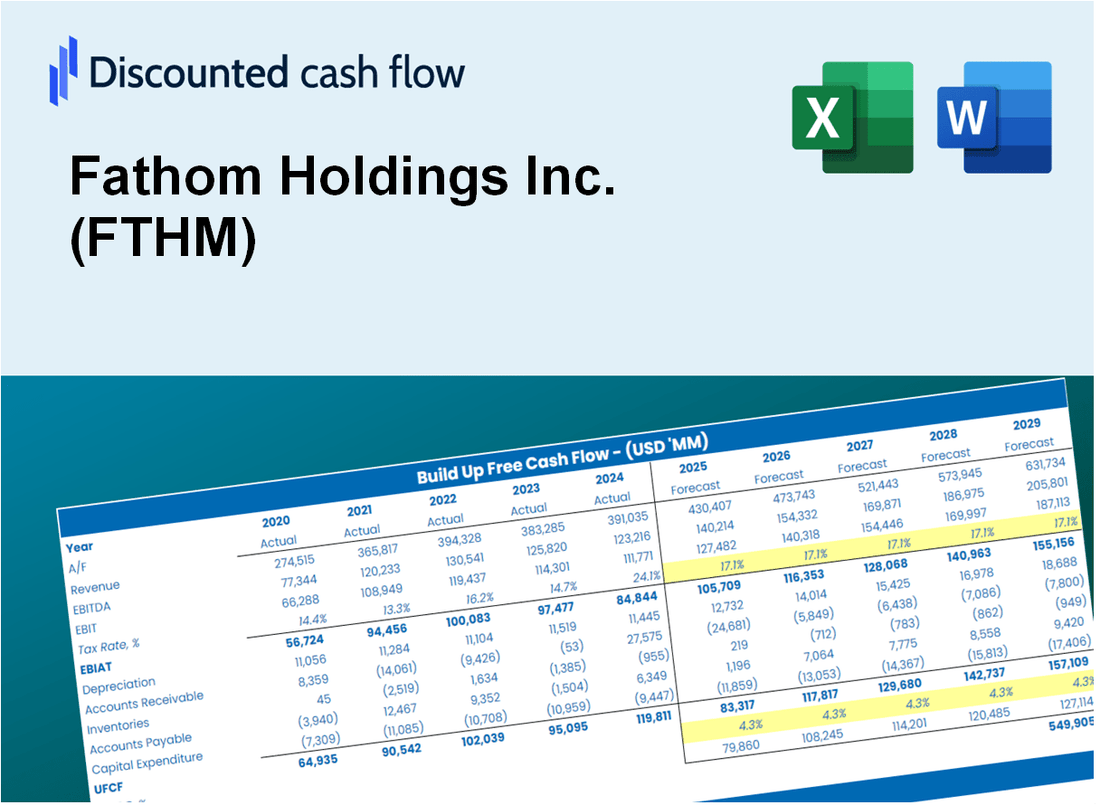
Fathom Holdings Inc. (FTHM) Évaluation DCF |
Entièrement Modifiable: Adapté À Vos Besoins Dans Excel Ou Sheets
Conception Professionnelle: Modèles Fiables Et Conformes Aux Normes Du Secteur
Pré-Construits Pour Une Utilisation Rapide Et Efficace
Compatible MAC/PC, entièrement débloqué
Aucune Expertise N'Est Requise; Facile À Suivre
Fathom Holdings Inc. (FTHM) Bundle
Conçu pour précision, notre calculatrice FTHM DCF vous permet d'évaluer l'évaluation de Fathom Holdings Inc. à l'aide de données financières en temps réel, offrant une flexibilité complète pour modifier tous les paramètres essentiels pour une meilleure prévision.
What You Will Get
- Real FTHM Financial Data: Pre-filled with Fathom Holdings Inc.’s historical and projected data for precise analysis.
- Fully Editable Template: Modify key inputs like revenue growth, WACC, and EBITDA % with ease.
- Automatic Calculations: See Fathom Holdings Inc.’s intrinsic value update instantly based on your changes.
- Professional Valuation Tool: Designed for investors, analysts, and consultants seeking accurate DCF results.
- User-Friendly Design: Simple structure and clear instructions for all experience levels.
Key Features
- Comprehensive DCF Calculator: Offers both unlevered and levered DCF valuation models tailored for Fathom Holdings Inc. (FTHM).
- WACC Calculator: Features a pre-structured Weighted Average Cost of Capital sheet with adjustable parameters.
- Customizable Forecast Assumptions: Easily alter growth rates, capital expenditures, and discount rates to fit FTHM's financial outlook.
- Integrated Financial Ratios: Evaluate profitability, leverage, and efficiency ratios specifically for Fathom Holdings Inc. (FTHM).
- Interactive Dashboard and Charts: Visual representations provide a clear overview of essential valuation metrics for streamlined analysis.
How It Works
- Download: Get the pre-built Excel file containing Fathom Holdings Inc.'s (FTHM) financial data.
- Customize: Modify projections, such as revenue growth, EBITDA %, and WACC.
- Update Automatically: Watch as the intrinsic value and NPV calculations refresh in real-time.
- Test Scenarios: Develop various forecasts and instantly compare the results.
- Make Decisions: Leverage the valuation outcomes to inform your investment choices.
Why Choose This Calculator?
- Accurate Data: Real Fathom Holdings Inc. (FTHM) financials ensure reliable valuation results.
- Customizable: Adjust key parameters like growth rates, WACC, and tax rates to align with your forecasts.
- Time-Saving: Pre-built calculations save you the effort of starting from scratch.
- Professional-Grade Tool: Tailored for investors, analysts, and consultants.
- User-Friendly: Intuitive design and step-by-step guidance make it accessible for all users.
Who Should Use Fathom Holdings Inc. (FTHM)?
- Real Estate Professionals: Enhance your understanding of market trends and valuation techniques.
- Academics: Utilize Fathom's models for teaching or research in real estate and business.
- Investors: Analyze your investment strategies and evaluate the performance of Fathom Holdings Inc. (FTHM).
- Market Analysts: Optimize your analysis with a customizable model tailored for real estate markets.
- Entrepreneurs: Learn how public companies like Fathom Holdings Inc. (FTHM) navigate the real estate landscape.
What the Template Contains
- Historical Data: Includes Fathom Holdings Inc.'s past financials and baseline forecasts.
- DCF and Levered DCF Models: Detailed templates to calculate Fathom Holdings Inc.'s intrinsic value.
- WACC Sheet: Pre-built calculations for Weighted Average Cost of Capital.
- Editable Inputs: Modify key drivers like growth rates, EBITDA %, and CAPEX assumptions.
- Quarterly and Annual Statements: A complete breakdown of Fathom Holdings Inc.'s financials.
- Interactive Dashboard: Visualize valuation results and projections dynamically.
Disclaimer
All information, articles, and product details provided on this website are for general informational and educational purposes only. We do not claim any ownership over, nor do we intend to infringe upon, any trademarks, copyrights, logos, brand names, or other intellectual property mentioned or depicted on this site. Such intellectual property remains the property of its respective owners, and any references here are made solely for identification or informational purposes, without implying any affiliation, endorsement, or partnership.
We make no representations or warranties, express or implied, regarding the accuracy, completeness, or suitability of any content or products presented. Nothing on this website should be construed as legal, tax, investment, financial, medical, or other professional advice. In addition, no part of this site—including articles or product references—constitutes a solicitation, recommendation, endorsement, advertisement, or offer to buy or sell any securities, franchises, or other financial instruments, particularly in jurisdictions where such activity would be unlawful.
All content is of a general nature and may not address the specific circumstances of any individual or entity. It is not a substitute for professional advice or services. Any actions you take based on the information provided here are strictly at your own risk. You accept full responsibility for any decisions or outcomes arising from your use of this website and agree to release us from any liability in connection with your use of, or reliance upon, the content or products found herein.