
|
Gail Limited (Gail.NS) Valation DCF |
Entièrement Modifiable: Adapté À Vos Besoins Dans Excel Ou Sheets
Conception Professionnelle: Modèles Fiables Et Conformes Aux Normes Du Secteur
Pré-Construits Pour Une Utilisation Rapide Et Efficace
Compatible MAC/PC, entièrement débloqué
Aucune Expertise N'Est Requise; Facile À Suivre
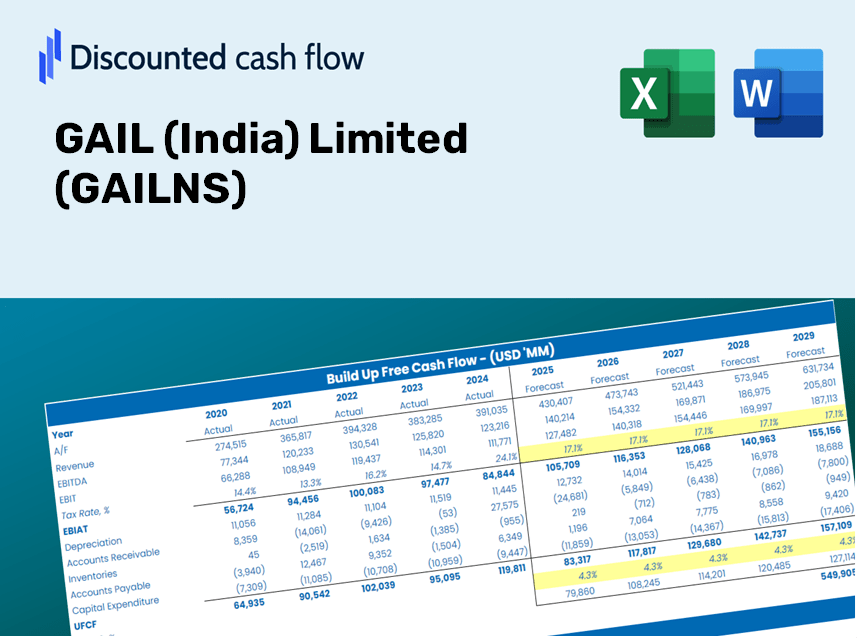
GAIL (India) Limited (GAIL.NS) Bundle
Rationalisez votre analyse et améliorez la précision avec notre calculatrice (Gailns) DCF! En utilisant des données réelles de Gail (India) Hypothèses limitées et personnalisables, cet outil vous permet de prévoir, d'évaluer et d'évaluer (Gailns) comme un investisseur chevronné.
Discounted Cash Flow (DCF) - (USD MM)
| Year | AY1 2021 |
AY2 2022 |
AY3 2023 |
AY4 2024 |
AY5 2025 |
FY1 2026 |
FY2 2027 |
FY3 2028 |
FY4 2029 |
FY5 2030 |
|---|---|---|---|---|---|---|---|---|---|---|
| Revenue | 571,517.7 | 925,320.5 | 1,456,683.0 | 1,332,284.6 | 1,419,034.9 | 1,835,174.3 | 2,373,348.7 | 3,069,345.6 | 3,969,447.2 | 5,133,508.3 |
| Revenue Growth, % | 0 | 61.91 | 57.42 | -8.54 | 6.51 | 29.33 | 29.33 | 29.33 | 29.33 | 29.33 |
| EBITDA | 83,463.7 | 163,223.0 | 89,115.2 | 153,438.9 | 206,427.3 | 236,462.8 | 305,806.8 | 395,486.2 | 511,464.6 | 661,454.2 |
| EBITDA, % | 14.6 | 17.64 | 6.12 | 11.52 | 14.55 | 12.89 | 12.89 | 12.89 | 12.89 | 12.89 |
| Depreciation | 21,676.0 | 24,218.7 | 27,959.9 | 37,114.8 | 37,992.3 | 50,623.6 | 65,469.3 | 84,668.5 | 109,498.0 | 141,608.8 |
| Depreciation, % | 3.79 | 2.62 | 1.92 | 2.79 | 2.68 | 2.76 | 2.76 | 2.76 | 2.76 | 2.76 |
| EBIT | 61,787.7 | 139,004.3 | 61,155.3 | 116,324.1 | 168,435.0 | 185,839.2 | 240,337.5 | 310,817.7 | 401,966.6 | 519,845.4 |
| EBIT, % | 10.81 | 15.02 | 4.2 | 8.73 | 11.87 | 10.13 | 10.13 | 10.13 | 10.13 | 10.13 |
| Total Cash | 22,968.9 | 25,223.6 | 8,053.6 | 14,638.8 | 38,715.1 | 40,831.8 | 52,806.0 | 68,291.6 | 88,318.4 | 114,218.3 |
| Total Cash, percent | .0 | .0 | .0 | .0 | .0 | .0 | .0 | .0 | .0 | .0 |
| Account Receivables | 43,977.4 | 89,495.1 | 123,133.2 | 106,566.6 | 95,109.1 | 148,725.4 | 192,339.9 | 248,744.6 | 321,690.3 | 416,027.6 |
| Account Receivables, % | 7.69 | 9.67 | 8.45 | 8 | 6.7 | 8.1 | 8.1 | 8.1 | 8.1 | 8.1 |
| Inventories | 29,897.3 | 35,766.1 | 59,179.2 | 59,700.0 | 62,499.2 | 80,910.8 | 104,638.3 | 135,324.1 | 175,008.5 | 226,330.7 |
| Inventories, % | 5.23 | 3.87 | 4.06 | 4.48 | 4.4 | 4.41 | 4.41 | 4.41 | 4.41 | 4.41 |
| Accounts Payable | 44,531.8 | 53,612.6 | 71,435.6 | 66,396.7 | 77,598.5 | 106,226.7 | 137,378.3 | 177,665.2 | 229,766.4 | 297,146.6 |
| Accounts Payable, % | 7.79 | 5.79 | 4.9 | 4.98 | 5.47 | 5.79 | 5.79 | 5.79 | 5.79 | 5.79 |
| Capital Expenditure | -56,972.1 | -69,712.8 | -88,305.6 | -125,011.7 | -79,297.1 | -141,440.3 | -182,918.4 | -236,560.2 | -305,932.7 | -395,649.0 |
| Capital Expenditure, % | -9.97 | -7.53 | -6.06 | -9.38 | -5.59 | -7.71 | -7.71 | -7.71 | -7.71 | -7.71 |
| Tax Rate, % | 22.65 | 22.65 | 22.65 | 22.65 | 22.65 | 22.65 | 22.65 | 22.65 | 22.65 | 22.65 |
| EBITAT | 49,078.2 | 110,172.0 | 47,330.5 | 91,426.5 | 130,283.7 | 145,708.4 | 188,438.1 | 243,698.6 | 315,164.4 | 407,588.0 |
| Depreciation | ||||||||||
| Changes in Account Receivables | ||||||||||
| Changes in Inventories | ||||||||||
| Changes in Accounts Payable | ||||||||||
| Capital Expenditure | ||||||||||
| UFCF | -15,560.8 | 22,372.2 | -52,243.4 | 14,536.5 | 108,839.0 | 11,492.0 | 34,798.5 | 45,003.3 | 58,200.8 | 75,268.5 |
| WACC, % | 6.1 | 6.1 | 6.09 | 6.1 | 6.09 | 6.1 | 6.1 | 6.1 | 6.1 | 6.1 |
| PV UFCF | ||||||||||
| SUM PV UFCF | 181,344.9 | |||||||||
| Long Term Growth Rate, % | 3.00 | |||||||||
| Free cash flow (T + 1) | 77,527 | |||||||||
| Terminal Value | 2,502,857 | |||||||||
| Present Terminal Value | 1,861,700 | |||||||||
| Enterprise Value | 2,043,045 | |||||||||
| Net Debt | 202,782 | |||||||||
| Equity Value | 1,840,263 | |||||||||
| Diluted Shares Outstanding, MM | 6,577 | |||||||||
| Equity Value Per Share | 279.81 |
Benefits You Will Receive
- Pre-Filled Financial Model: Utilize GAIL (India) Limited’s actual data for accurate DCF valuation.
- Complete Control Over Forecasts: Modify revenue growth, profit margins, WACC, and other crucial factors.
- Real-Time Calculations: Automatic updates ensure results are instantly visible as adjustments are made.
- Investor-Ready Format: A polished Excel template crafted for professional valuation purposes.
- Flexible and Reusable: Designed for adaptability, allowing for repeated application in detailed forecasting.
Key Features
- Pre-Loaded Data: GAIL (India) Limited’s historical financial statements and pre-filled forecasts.
- Fully Adjustable Inputs: Customize WACC, tax rates, revenue growth, and EBITDA margins.
- Instant Results: View GAIL (India) Limited’s intrinsic value recalculated in real time.
- Clear Visual Outputs: Dashboard charts illustrate valuation results and essential metrics.
- Built for Accuracy: A professional tool designed for analysts, investors, and finance professionals.
How It Operates
- Download: Obtain the pre-prepared Excel file containing GAIL (India) Limited's (GAILNS) financial metrics.
- Personalize: Modify projections, such as revenue growth, EBITDA %, and WACC.
- Automatic Updates: The intrinsic value and NPV calculations refresh in real-time.
- Scenario Testing: Develop various projections and instantly compare the results.
- Informed Decisions: Leverage the valuation findings to inform your investment choices.
Why Opt for GAIL (India) Limited (GAILNS) Calculator?
- Designed for Experts: A sophisticated tool favored by analysts, CFOs, and industry consultants.
- Accurate Financial Data: GAIL's historical and forecasted financials are preloaded for your convenience.
- Flexible Scenario Analysis: Effortlessly simulate various forecasts and assumptions.
- Comprehensive Outputs: Instantly computes intrinsic value, NPV, and essential metrics.
- User-Friendly: Detailed, step-by-step instructions ensure a smooth user experience.
Who Can Benefit from GAIL (India) Limited [GAILNS]?
- Investors: Make well-informed choices with our industry-leading valuation resources.
- Financial Analysts: Enhance productivity with our customizable DCF model designed for efficiency.
- Consultants: Effortlessly modify templates for impactful client presentations or detailed reports.
- Finance Enthusiasts: Expand your knowledge of valuation methodologies through practical, real-world insights.
- Educators and Students: Utilize our tools as effective resources in finance-focused curricula.
Overview of the GAIL (India) Limited [GAILNS] Template
- In-Depth DCF Model: Editable template featuring comprehensive valuation calculations.
- Actual Financial Data: GAIL (India) Limited's historical and projected financial figures preloaded for analysis.
- Adjustable Parameters: Customize WACC, growth rates, and tax assumptions to explore various scenarios.
- Complete Financial Statements: Detailed annual and quarterly reports for enhanced insights.
- Essential Ratios: Integrated analysis of profitability, efficiency, and leverage metrics.
- Interactive Dashboard with Visual Representations: Charts and tables that deliver clear, actionable results.
Disclaimer
All information, articles, and product details provided on this website are for general informational and educational purposes only. We do not claim any ownership over, nor do we intend to infringe upon, any trademarks, copyrights, logos, brand names, or other intellectual property mentioned or depicted on this site. Such intellectual property remains the property of its respective owners, and any references here are made solely for identification or informational purposes, without implying any affiliation, endorsement, or partnership.
We make no representations or warranties, express or implied, regarding the accuracy, completeness, or suitability of any content or products presented. Nothing on this website should be construed as legal, tax, investment, financial, medical, or other professional advice. In addition, no part of this site—including articles or product references—constitutes a solicitation, recommendation, endorsement, advertisement, or offer to buy or sell any securities, franchises, or other financial instruments, particularly in jurisdictions where such activity would be unlawful.
All content is of a general nature and may not address the specific circumstances of any individual or entity. It is not a substitute for professional advice or services. Any actions you take based on the information provided here are strictly at your own risk. You accept full responsibility for any decisions or outcomes arising from your use of this website and agree to release us from any liability in connection with your use of, or reliance upon, the content or products found herein.