
|
Genesco Inc. (GCO) Évaluation DCF |
Entièrement Modifiable: Adapté À Vos Besoins Dans Excel Ou Sheets
Conception Professionnelle: Modèles Fiables Et Conformes Aux Normes Du Secteur
Pré-Construits Pour Une Utilisation Rapide Et Efficace
Compatible MAC/PC, entièrement débloqué
Aucune Expertise N'Est Requise; Facile À Suivre
Genesco Inc. (GCO) Bundle
Explorez le potentiel financier de Genesco Inc. (GCO) avec notre calculatrice DCF conviviale! Entrez vos projections pour la croissance, les marges et les dépenses pour calculer la valeur intrinsèque de Genesco Inc. (GCO) et informer vos décisions d'investissement.
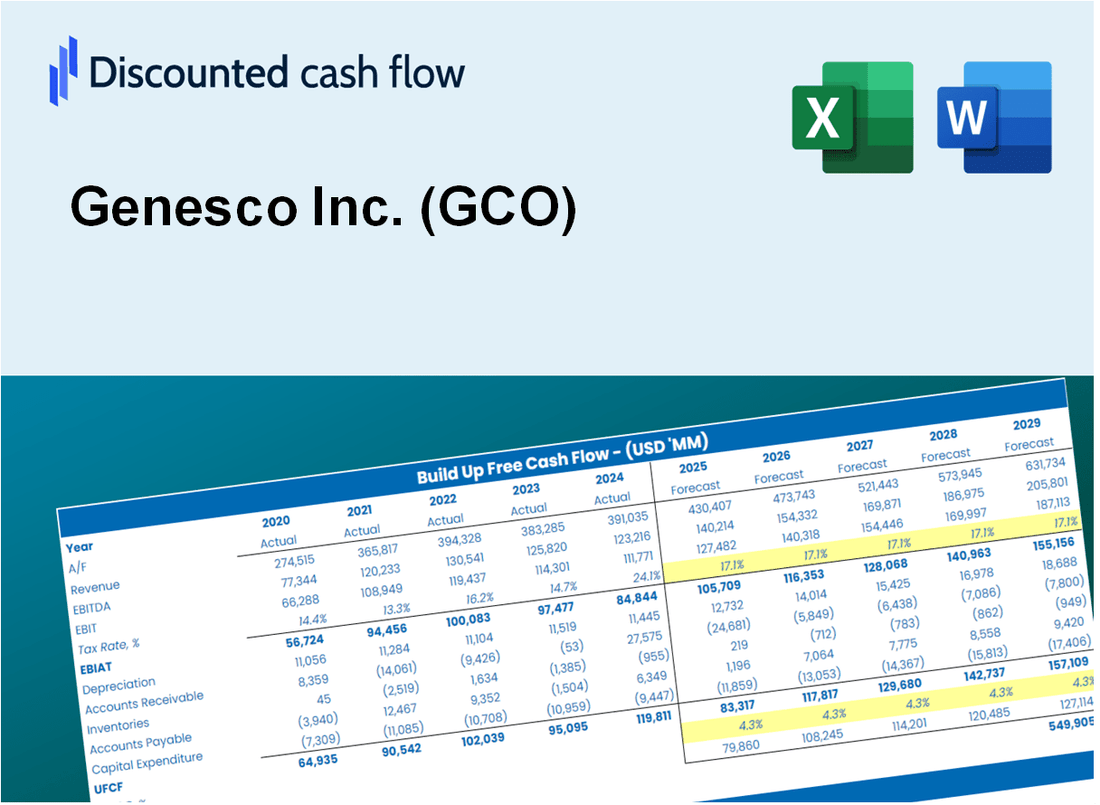
Discounted Cash Flow (DCF) - (USD MM)
| Year | AY1 2021 |
AY2 2022 |
AY3 2023 |
AY4 2024 |
AY5 2025 |
FY1 2026 |
FY2 2027 |
FY3 2028 |
FY4 2029 |
FY5 2030 |
|---|---|---|---|---|---|---|---|---|---|---|
| Revenue | 1,786.5 | 2,422.1 | 2,384.9 | 2,324.6 | 2,325.1 | 2,159.7 | 2,006.0 | 1,863.3 | 1,730.8 | 1,607.7 |
| Revenue Growth, % | 0 | 35.57 | -1.54 | -2.53 | 0.01884176 | -7.11 | -7.11 | -7.11 | -7.11 | -7.11 |
| EBITDA | -59.7 | 190.4 | 136.7 | 35.8 | 66.7 | 63.3 | 58.8 | 54.6 | 50.8 | 47.1 |
| EBITDA, % | -3.34 | 7.86 | 5.73 | 1.54 | 2.87 | 2.93 | 2.93 | 2.93 | 2.93 | 2.93 |
| Depreciation | 46.5 | 43.0 | 42.8 | 49.4 | 52.5 | 45.6 | 42.3 | 39.3 | 36.5 | 33.9 |
| Depreciation, % | 2.6 | 1.77 | 1.8 | 2.13 | 2.26 | 2.11 | 2.11 | 2.11 | 2.11 | 2.11 |
| EBIT | -106.2 | 147.4 | 93.8 | -13.6 | 14.3 | 17.7 | 16.5 | 15.3 | 14.2 | 13.2 |
| EBIT, % | -5.94 | 6.09 | 3.93 | -0.58491 | 0.61323 | 0.82121 | 0.82121 | 0.82121 | 0.82121 | 0.82121 |
| Total Cash | 215.1 | 320.5 | 48.0 | 35.2 | 34.0 | 130.7 | 121.4 | 112.8 | 104.7 | 97.3 |
| Total Cash, percent | .0 | .0 | .0 | .0 | .0 | .0 | .0 | .0 | .0 | .0 |
| Account Receivables | 31.4 | 39.5 | 40.8 | 53.6 | 48.9 | 41.1 | 38.2 | 35.4 | 32.9 | 30.6 |
| Account Receivables, % | 1.76 | 1.63 | 1.71 | 2.31 | 2.1 | 1.9 | 1.9 | 1.9 | 1.9 | 1.9 |
| Inventories | 291.0 | 278.2 | 458.0 | 379.0 | 425.2 | 352.3 | 327.3 | 304.0 | 282.4 | 262.3 |
| Inventories, % | 16.29 | 11.49 | 19.2 | 16.3 | 18.29 | 16.31 | 16.31 | 16.31 | 16.31 | 16.31 |
| Accounts Payable | 150.4 | 152.5 | 145.0 | 114.6 | 168.1 | 142.3 | 132.2 | 122.8 | 114.1 | 106.0 |
| Accounts Payable, % | 8.42 | 6.3 | 6.08 | 4.93 | 7.23 | 6.59 | 6.59 | 6.59 | 6.59 | 6.59 |
| Capital Expenditure | -24.1 | -53.9 | -59.9 | -60.3 | -41.1 | -45.1 | -41.9 | -39.0 | -36.2 | -33.6 |
| Capital Expenditure, % | -1.35 | -2.23 | -2.51 | -2.59 | -1.77 | -2.09 | -2.09 | -2.09 | -2.09 | -2.09 |
| Tax Rate, % | 302.94 | 302.94 | 302.94 | 302.94 | 302.94 | 302.94 | 302.94 | 302.94 | 302.94 | 302.94 |
| EBITAT | -53.3 | 110.6 | 74.9 | -10.5 | -28.9 | 10.0 | 9.3 | 8.6 | 8.0 | 7.5 |
| Depreciation | ||||||||||
| Changes in Account Receivables | ||||||||||
| Changes in Inventories | ||||||||||
| Changes in Accounts Payable | ||||||||||
| Capital Expenditure | ||||||||||
| UFCF | -202.8 | 106.4 | -130.8 | 14.5 | -5.7 | 65.4 | 27.6 | 25.6 | 23.8 | 22.1 |
| WACC, % | 6.88 | 7.44 | 7.54 | 7.49 | 5.76 | 7.02 | 7.02 | 7.02 | 7.02 | 7.02 |
| PV UFCF | ||||||||||
| SUM PV UFCF | 140.0 | |||||||||
| Long Term Growth Rate, % | 0.50 | |||||||||
| Free cash flow (T + 1) | 22 | |||||||||
| Terminal Value | 341 | |||||||||
| Present Terminal Value | 243 | |||||||||
| Enterprise Value | 383 | |||||||||
| Net Debt | 451 | |||||||||
| Equity Value | -68 | |||||||||
| Diluted Shares Outstanding, MM | 11 | |||||||||
| Equity Value Per Share | -6.32 |
What You Will Get
- Comprehensive GCO Financials: Access to historical and projected data for precise valuation.
- Customizable Inputs: Adjust WACC, tax rates, revenue growth, and capital expenditures as needed.
- Real-Time Calculations: Intrinsic value and NPV are computed automatically.
- Scenario Testing: Evaluate various scenarios to assess Genesco’s future performance.
- User-Friendly Interface: Designed for industry professionals while remaining easy for newcomers.
Key Features
- Real-Life GCO Data: Pre-filled with Genesco Inc.'s historical financials and future projections.
- Fully Customizable Inputs: Modify revenue growth, profit margins, WACC, tax rates, and capital expenditures.
- Dynamic Valuation Model: Automatic updates to Net Present Value (NPV) and intrinsic value based on your inputs.
- Scenario Testing: Create various forecast scenarios to evaluate different valuation outcomes.
- User-Friendly Design: Intuitive, organized, and crafted for both professionals and newcomers.
How It Works
- Download: Obtain the pre-prepared Excel file containing Genesco Inc.'s (GCO) financial data.
- Customize: Modify projections, including sales growth, EBITDA margin, and WACC.
- Update Automatically: The intrinsic value and NPV calculations refresh in real-time.
- Test Scenarios: Generate various forecasts and evaluate results instantly.
- Make Decisions: Utilize the valuation findings to inform your investment approach.
Why Choose Genesco Inc. (GCO)?
- Established Reputation: A long-standing history in the retail industry ensures reliability.
- Diverse Portfolio: Offers a wide range of brands and products to meet various customer needs.
- Commitment to Quality: Focus on high standards in product offerings enhances customer satisfaction.
- Strong Financial Performance: Consistent growth and profitability demonstrate sound management.
- Innovation Driven: Emphasis on adapting to market trends keeps the brand relevant.
Who Should Use This Product?
- Finance Students: Explore valuation methodologies and apply them using real-time data for Genesco Inc. (GCO).
- Academics: Integrate industry-standard models into your lectures or research focused on retail analysis.
- Investors: Validate your investment hypotheses and evaluate valuation scenarios for Genesco Inc. (GCO).
- Analysts: Enhance your efficiency with a customizable DCF model tailored for Genesco Inc. (GCO).
- Small Business Owners: Understand the valuation approaches used for analyzing large retail companies like Genesco Inc. (GCO).
What the Template Contains
- Operating and Balance Sheet Data: Pre-filled Genesco Inc. (GCO) historical data and forecasts, including revenue, EBITDA, EBIT, and capital expenditures.
- WACC Calculation: A dedicated sheet for Weighted Average Cost of Capital (WACC), including parameters like Beta, risk-free rate, and share price.
- DCF Valuation (Unlevered and Levered): Editable Discounted Cash Flow models showing intrinsic value with detailed calculations.
- Financial Statements: Pre-loaded financial statements (annual and quarterly) to support analysis.
- Key Ratios: Includes profitability, leverage, and efficiency ratios for Genesco Inc. (GCO).
- Dashboard and Charts: Visual summary of valuation outputs and assumptions to analyze results easily.
Disclaimer
All information, articles, and product details provided on this website are for general informational and educational purposes only. We do not claim any ownership over, nor do we intend to infringe upon, any trademarks, copyrights, logos, brand names, or other intellectual property mentioned or depicted on this site. Such intellectual property remains the property of its respective owners, and any references here are made solely for identification or informational purposes, without implying any affiliation, endorsement, or partnership.
We make no representations or warranties, express or implied, regarding the accuracy, completeness, or suitability of any content or products presented. Nothing on this website should be construed as legal, tax, investment, financial, medical, or other professional advice. In addition, no part of this site—including articles or product references—constitutes a solicitation, recommendation, endorsement, advertisement, or offer to buy or sell any securities, franchises, or other financial instruments, particularly in jurisdictions where such activity would be unlawful.
All content is of a general nature and may not address the specific circumstances of any individual or entity. It is not a substitute for professional advice or services. Any actions you take based on the information provided here are strictly at your own risk. You accept full responsibility for any decisions or outcomes arising from your use of this website and agree to release us from any liability in connection with your use of, or reliance upon, the content or products found herein.