
|
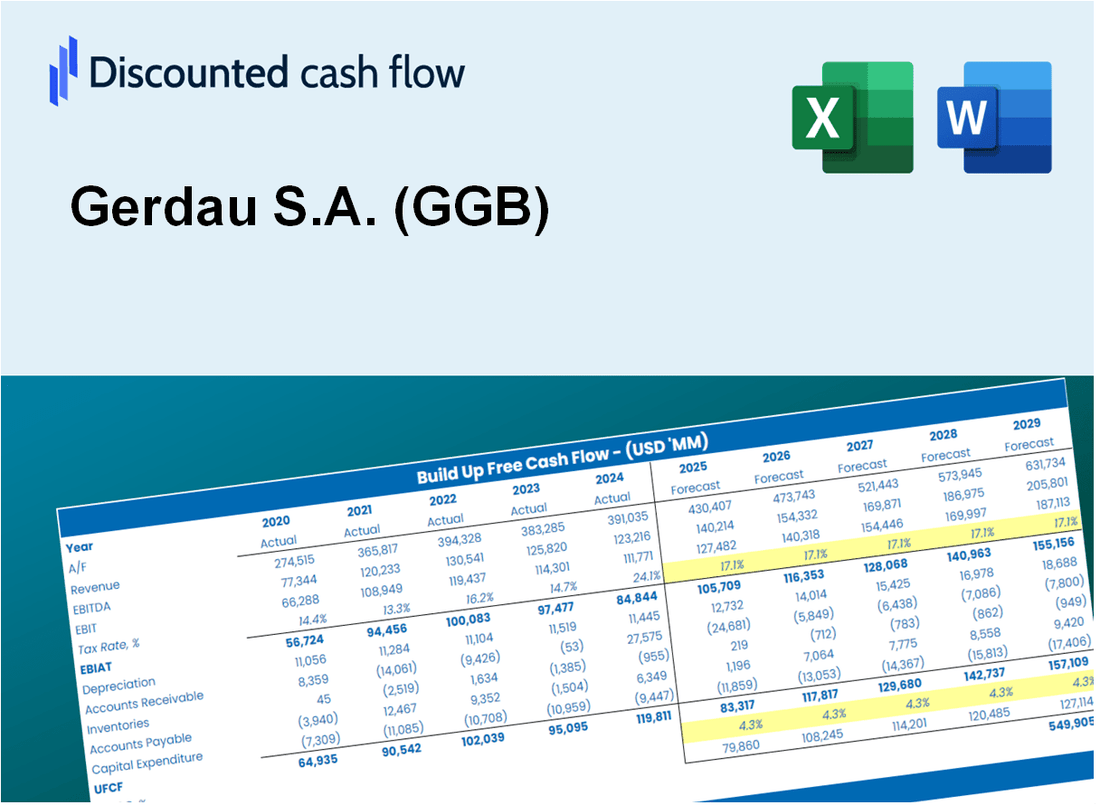
Gerdau S.A. (GGB) Évaluation DCF |
Entièrement Modifiable: Adapté À Vos Besoins Dans Excel Ou Sheets
Conception Professionnelle: Modèles Fiables Et Conformes Aux Normes Du Secteur
Pré-Construits Pour Une Utilisation Rapide Et Efficace
Compatible MAC/PC, entièrement débloqué
Aucune Expertise N'Est Requise; Facile À Suivre
Gerdau S.A. (GGB) Bundle
Améliorez vos stratégies d'investissement avec la calculatrice DCF Gerdau S.A. (GGB)! Explorez de véritables données financières pour Gerdau, ajustez les projections et dépenses de croissance et observez comment ces modifications affectent la valeur intrinsèque de Gerdau en temps réel.
What You Will Get
- Real GGB Financials: Access to historical and projected data for precise valuation.
- Customizable Inputs: Adjust WACC, tax rates, revenue growth, and capital expenditures as needed.
- Instant Calculations: Intrinsic value and NPV are computed in real-time.
- Scenario Analysis: Explore various scenarios to assess Gerdau’s future performance.
- User-Friendly Design: Designed for professionals while being approachable for newcomers.
Key Features
- Customizable Financial Metrics: Adjust essential inputs such as production volume, operating margin, and capital investments.
- Instant DCF Valuation: Quickly computes intrinsic value, net present value (NPV), and various financial outputs.
- Industry-Leading Precision: Incorporates Gerdau’s actual financial data for accurate valuation results.
- Effortless Scenario Testing: Easily evaluate different scenarios and analyze their impacts on outcomes.
- Efficiency Boost: Streamline the valuation process without the need to create intricate models from the ground up.
How It Works
- Download the Template: Gain immediate access to the Excel-based Gerdau S.A. (GGB) DCF Calculator.
- Input Your Assumptions: Modify the yellow-highlighted cells for growth rates, WACC, margins, and additional variables.
- Instant Calculations: The model automatically calculates Gerdau’s intrinsic value.
- Test Scenarios: Experiment with various assumptions to assess potential changes in valuation.
- Analyze and Decide: Leverage the results to inform your investment or financial analysis.
Why Choose the Gerdau S.A. (GGB) Calculator?
- Precision: Utilizes authentic Gerdau financial data for accurate calculations.
- Versatility: Built to allow users to easily experiment and adjust inputs.
- Efficiency: Eliminate the need to construct a DCF model from the ground up.
- Expert-Level: Crafted with the expertise and functionality expected by CFOs.
- Intuitive: Simple interface makes it accessible for users with varying financial backgrounds.
Who Should Use This Product?
- Individual Investors: Make informed decisions about buying or selling Gerdau S.A. (GGB) stock.
- Financial Analysts: Streamline valuation processes with ready-to-use financial models for Gerdau S.A. (GGB).
- Consultants: Deliver professional valuation insights on Gerdau S.A. (GGB) to clients quickly and accurately.
- Business Owners: Understand how large companies like Gerdau S.A. (GGB) are valued to guide your own strategy.
- Finance Students: Learn valuation techniques using real-world data and scenarios related to Gerdau S.A. (GGB).
What the Template Contains
- Preloaded GGB Data: Historical and projected financial data, including revenue, EBIT, and capital expenditures.
- DCF and WACC Models: Professional-grade sheets for calculating intrinsic value and Weighted Average Cost of Capital.
- Editable Inputs: Yellow-highlighted cells for adjusting revenue growth, tax rates, and discount rates.
- Financial Statements: Comprehensive annual and quarterly financials for deeper analysis.
- Key Ratios: Profitability, leverage, and efficiency ratios to evaluate performance.
- Dashboard and Charts: Visual summaries of valuation outcomes and assumptions.
Disclaimer
All information, articles, and product details provided on this website are for general informational and educational purposes only. We do not claim any ownership over, nor do we intend to infringe upon, any trademarks, copyrights, logos, brand names, or other intellectual property mentioned or depicted on this site. Such intellectual property remains the property of its respective owners, and any references here are made solely for identification or informational purposes, without implying any affiliation, endorsement, or partnership.
We make no representations or warranties, express or implied, regarding the accuracy, completeness, or suitability of any content or products presented. Nothing on this website should be construed as legal, tax, investment, financial, medical, or other professional advice. In addition, no part of this site—including articles or product references—constitutes a solicitation, recommendation, endorsement, advertisement, or offer to buy or sell any securities, franchises, or other financial instruments, particularly in jurisdictions where such activity would be unlawful.
All content is of a general nature and may not address the specific circumstances of any individual or entity. It is not a substitute for professional advice or services. Any actions you take based on the information provided here are strictly at your own risk. You accept full responsibility for any decisions or outcomes arising from your use of this website and agree to release us from any liability in connection with your use of, or reliance upon, the content or products found herein.