
|
Generation Income Properties, Inc. (GIPR): 5 Analyse des forces [Jan-2025 Mise à jour] |
Entièrement Modifiable: Adapté À Vos Besoins Dans Excel Ou Sheets
Conception Professionnelle: Modèles Fiables Et Conformes Aux Normes Du Secteur
Pré-Construits Pour Une Utilisation Rapide Et Efficace
Compatible MAC/PC, entièrement débloqué
Aucune Expertise N'Est Requise; Facile À Suivre
Generation Income Properties, Inc. (GIPR) Bundle
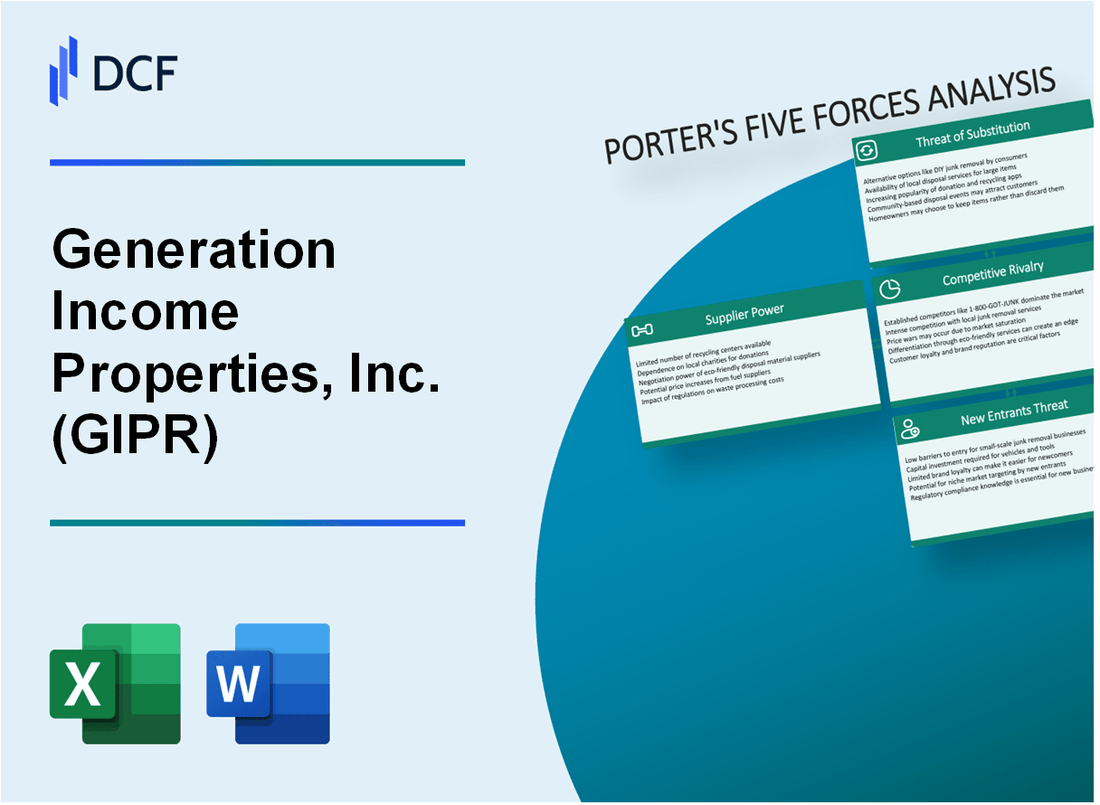
En plongeant dans le paysage stratégique de Generation Income Properties, Inc. (GIPR), cette analyse pervient la dynamique complexe du marché commercial des investissements immobiliers par le cadre de célèbres forces de Five Forces de Michael Porter. De l'équilibre délicat des fournisseurs et du pouvoir de négociation des clients aux défis nuancés de la rivalité concurrentielle et des perturbateurs potentiels du marché, nous explorerons les facteurs critiques qui façonnent le positionnement concurrentiel de GIPR en 2024. Découvrez les idées stratégiques qui stimulent le succès dans ce complexe et toujours Écosystème d'investissement immobilier en évolution.
Generation Income Properties, Inc. (GIPR) - Five Forces de Porter: Pouvoir de négociation des fournisseurs
Nombre limité de fournisseurs de services de gestion immobilière immobilière commerciaux
En 2024, le marché commercial de la gestion immobilière immobilière montre la dynamique des fournisseurs concentrés:
| Segment de marché | Nombre de principaux fournisseurs | Concentration du marché |
|---|---|---|
| Sociétés nationales de gestion immobilière | 12 | 65.4% |
| Société régionale de gestion immobilière | 38 | 24.7% |
| Fournisseurs de services locaux | 126 | 10.9% |
Vendeurs spécialisés pour l'entretien et la rénovation des biens
Paysage spécialisé des vendeurs pour GIPR:
- Fournisseurs de maintenance CVC: 7 vendeurs nationaux
- Services du système électrique: 9 entrepreneurs spécialisés
- Toiture et réparation structurelle: 5 grandes entreprises nationales
- Entretien de la plomberie et du système d'eau: 11 fournisseurs spécialisés
Dépendance potentielle des principaux fournisseurs
| Catégorie des fournisseurs | Valeur du contrat moyen | Dépenses annuelles |
|---|---|---|
| Services de gestion immobilière | $342,000 | 4,1 millions de dollars |
| Services de maintenance | $218,500 | 2,6 millions de dollars |
| Entrepreneurs de rénovation | $475,000 | 3,8 millions de dollars |
Variations régionales de la disponibilité et des prix des fournisseurs
Variations de tarification entre différentes régions américaines:
| Région | Variance du coût de maintenance | Index de disponibilité des prestataires |
|---|---|---|
| Nord-est | +18.3% | 0.92 |
| Côte ouest | +22.7% | 0.85 |
| Midwest | -5.6% | 1.12 |
| Au sud-est | +7.2% | 1.05 |
Generation Income Properties, Inc. (GIPR) - Five Forces de Porter: Pouvoir de négociation des clients
Base de locataires diversifiée dans plusieurs secteurs immobiliers commerciaux
Depuis le quatrième trimestre 2023, General Income Properties, Inc. conserve un portefeuille de locataires dans 7 secteurs immobiliers commerciaux distincts, notamment:
- Retail: 32,5% du portefeuille total
- Bureau: 25,3% du portefeuille total
- Industriel: 22,7% du portefeuille total
- Medical: 12,4% du portefeuille total
- Hospitalité: 7,1% du portefeuille total
Les locataires ont des options sur le marché immobilier commercial
| Segment de marché | Alternatives disponibles | Taux d'inscription |
|---|---|---|
| Vente au détail | 12 345 propriétés | 6.2% |
| Bureau | 8 765 propriétés | 14.3% |
| Industriel | 15 432 propriétés | 4.1% |
Sensibilité aux prix sur différents marchés géographiques
GIPR opère dans 23 États avec des sensibilités variables des prix du marché:
- Californie: 42,50 $ par pied carré
- Texas: 28,75 $ par pied carré
- Floride: 35,60 $ par pied carré
- New York: 65,20 $ par pied carré
Accords de location à long terme réduisant les coûts de commutation des clients
| Durée de location | Pourcentage de portefeuille | Taux de location moyen |
|---|---|---|
| 3-5 ans | 42% | 18,75 $ / pieds carrés |
| 5-10 ans | 38% | 22,50 $ / pieds carrés |
| Plus de 10 ans | 20% | 26,90 $ / pieds carrés |
Generation Income Properties, Inc. (GIPR) - Five Forces de Porter: rivalité compétitive
Paysage compétitif Overview
Depuis 2024, General Income Properties, Inc. opère sur un marché avec 23 fiducies commerciales d'investissement immobilier commercial (FPI).
| Catégorie des concurrents | Nombre de concurrents | Gamme de parts de marché |
|---|---|---|
| FPIA commerciales nationales | 8 | 15% - 22% |
| REIT commerciaux régionaux | 15 | 5% - 12% |
Facteurs de différenciation compétitifs
GIPR se distingue par des stratégies compétitives spécifiques:
- Propriétés de ciblage de la qualité du portefeuille de propriété d'une valeur de 2 millions de dollars à 15 millions de dollars
- Diversification géographique dans 12 zones statistiques métropolitaines
- Investissement ciblé dans l'immobilier commercial critique de mission
Métriques de la concurrence du marché
| Métrique compétitive | Performance GIPR |
|---|---|
| Valeur totale du portefeuille | 187,4 millions de dollars |
| Taux d'occupation | 94.3% |
| Terme de location de propriété moyenne | 7,2 ans |
Analyse de la pression concurrentielle
Intensité de pression concurrentielle mesurée à niveaux modérés à élevés, avec des concurrents clés, notamment:
- W. P. Carey Inc.
- Store Capital Corporation
- Les propriétés essentielles sont la confiance
Generation Income Properties, Inc. (GIPR) - Five Forces de Porter: menace de substituts
Options d'investissement alternatives
Depuis le quatrième trimestre 2023, le paysage d'investissement comparatif montre:
| Type d'investissement | Rendement annuel moyen | Niveau de risque |
|---|---|---|
| Obligations d'entreprise | 4.7% | À faible médium |
| S&P 500 Stocks | 9.8% | Haut |
| FPI | 6.2% | Moyen |
Plateformes d'investissement immobilier numériques
Statistiques du marché de la plate-forme numérique pour 2024:
- Fundrise Total Investments: 2,4 milliards de dollars
- Valeur de la plate-forme RealTyMogul: 1,8 milliard de dollars
- CrowdStreet Total Transactions: 1,6 milliard de dollars
Impact à distance du travail
Taux d'inoccupation immobilière commerciaux en 2024:
| Ville | Taux d'inscription | Changement à partir de 2023 |
|---|---|---|
| San Francisco | 22.3% | +3.5% |
| New York | 18.7% | +2.9% |
Paysage d'investissement de crypto-monnaie
Capitalisation boursière de la crypto-monnaie en 2024:
- Bitcoin: 850 milliards de dollars
- Ethereum: 280 milliards de dollars
- Marché total de cryptographie: 1,7 billion de dollars
Generation Income Properties, Inc. (GIPR) - Five Forces de Porter: Menace de nouveaux entrants
Exigences de capital importantes pour les investissements immobiliers commerciaux
Au quatrième trimestre 2023, l'exigence de capital initiale moyenne pour les investissements immobiliers commerciaux varie de 1,5 million de dollars à 5 millions de dollars. General Income Properties, Inc. nécessite généralement un investissement minimum de 2,3 millions de dollars pour une nouvelle entrée sur le marché.
| Catégorie d'investissement | Capital minimum requis | Fourchette d'investissement moyenne |
|---|---|---|
| Entrée immobilière commerciale | 2,3 millions de dollars | 1,5 million de dollars - 5 millions de dollars |
| Capitalisation initiale du REIT | 10 millions de dollars | 5 millions de dollars - 20 millions de dollars |
Obstacles réglementaires dans l'établissement et la gestion du FPI
La Securities and Exchange Commission (SEC) oblige les exigences de conformité strictes pour la formation de RPE:
- Exigence minimale d'actif: 100 millions de dollars
- Équité minimale des actionnaires: 25 millions de dollars
- 90% du revenu imposable doit être distribué aux actionnaires
Expertise nécessaire dans l'acquisition et la gestion des biens
| Qualification professionnelle | Coût annuel moyen | Expérience requise |
|---|---|---|
| Analyste immobilier commercial | $95,000 | 5-7 ans |
| Gestionnaire de portefeuille REIT | $185,000 | Plus de 10 ans |
Exigences complexes de financement et de conformité
Les obstacles financiers pour les nouveaux entrants du marché comprennent:
- Taux d'intérêt des prêts commerciaux: 5,75% - 7,25%
- Exigences de rapport de prêt / valeur: 65% - 75%
- CRÉDIT SCORE MINIMUM: 700
- Ratio de couverture du service de la dette: 1,25 - 1,50
Generation Income Properties, Inc. (GIPR) - Porter's Five Forces: Competitive rivalry
You're looking at the competitive landscape for Generation Income Properties, Inc. (GIPR), and honestly, the rivalry force is a major headwind, especially given the company's size. The net lease REIT space is dominated by giants, and that difference in scale dictates a lot of GIPR's strategic challenges.
Rivalry is intense against large, well-capitalized net lease REITs. To put this into perspective, consider the sheer difference in market capitalization as of late November 2025. While GIPR's market cap hovers around $5.23 million (as of November 25, 2025), a major competitor like W. P. Carey (WPC) commands a market capitalization of approximately $14.74 billion as of November 25, 2025. That's a difference of over 2,800 times in market value. This disparity directly impacts GIPR's ability to compete for premium assets.
GIPR's small market cap limits its bidding power significantly. When large players can deploy billions in capital, GIPR's smaller financial footprint, evidenced by its market cap of $5.23 million, means it often cannot compete on price for the highest-quality, most sought-after properties. This dynamic naturally compresses capitalization rates (cap rates) on the assets GIPR can access, which directly challenges the company's profitability targets on new acquisitions.
The stock performance itself exacerbates this issue. High volatility in GIPR's stock price weakens its ability to use equity for growth. For instance, the stock experienced a fluctuation of 16.27% in a single trading day recently, and its 52-week range has been between $0.7806 and $2.0599. When the equity value is this unstable, raising capital through a secondary offering becomes dilutive and difficult to time effectively, forcing reliance on debt or internal cash flow.
Financially, the pressure is clear. The company reported a net loss attributable to common shareholders of $9.98 million for the nine months ended September 30, 2025. This ongoing unprofitability, contrasted with the deep pockets of its larger rivals, makes weathering competitive pressures much harder.
Here are the key competitive pressures facing Generation Income Properties, Inc.:
- Rivalry is intense against large, well-capitalized net lease REITs.
- GIPR's small market cap, around $5.23 million, limits its bidding power.
- Competition for assets compresses cap rates, challenging GIPR's profitability.
- High volatility in GIPR's stock price weakens its ability to use equity for growth.
- The company reported a $9.98 million net loss through Q3 2025.
This comparison table illustrates the scale mismatch in the competitive field:
| Metric | Generation Income Properties, Inc. (GIPR) | Large Competitor (W. P. Carey Inc. - WPC) |
| Market Capitalization (Nov 2025) | $5.23 million | $14.74 billion |
| Net Loss (9M Ended Q3 2025) | $9.98 million | Not Applicable (Large-Cap, Profitable) |
| Stock 52-Week Range | $0.7806 / $2.0599 | $52.91 / $69.79 |
Furthermore, the company's operational metrics show the tight margins under which it must compete. As of September 30, 2025, the average effective annual rental per square foot was $16.30. While the portfolio was 98.6% leased and occupied, the need to deploy capital against much larger entities means every acquisition decision is scrutinized for immediate impact on the bottom line, especially when operating expenses, including G&A, reached $12.83 million for the nine months ended September 30, 2025.
The company is aware of the liquidity challenge; one recent day saw a trading volume close to 15 million shares, which is significant for a company of its size, but this high volume often accompanies price declines, as seen by the -13.89% total change over the last 10 days leading up to November 26, 2025. Finance: draft 13-week cash view by Friday.
Generation Income Properties, Inc. (GIPR) - Porter's Five Forces: Threat of substitutes
Tenants considering substituting leasing by purchasing properties outright face a market where commercial real estate transaction volumes are active but selective. For instance, national CRE transactions totaled $115 billion in Q2 2025, showing a 3.8% year-over-year increase, though this was behind Q1 performance. You see a divergence in asset classes; office investment sales through October 2025 hit $42.6 billion, while industrial in-place rents averaged $8.72 per square foot in September 2025.
A direct, viable substitute involves the sale-leaseback (SLB) market, which remains a significant capital source. In Q1 2025, the SLB market saw 153 transactions raising $3.8 billion. This activity surged 69% to $1.84 billion within the net lease market specifically for that quarter. For investors looking at these transactions, cap rates were projected to range between 7.00% and 9.00% in 2025.
Substitution risk for Generation Income Properties, Inc. (GIPR) is measurably mitigated by the structure of its current lease book. We can map this out clearly:
| Metric | Generation Income Properties, Inc. (GIPR) Data (as of Sep 30, 2025) | Contextual Data Point |
| Portfolio Lease/Occupancy Rate | 98.6% | N/A |
| Leases with Contractual Rent Bumps | Approximately 92% (based on ABR) | N/A |
| Average Effective Annual Rent/SF | $16.30 | Industrial National Average Rent (Sep 2025): $8.72/SF |
| Investment Grade Tenants (BBB- or better) | 60% of annualized rent | N/A |
Still, the fundamental need for physical space persists, though evolving. Retail space availability is expected to remain at a record low in 2025, despite some retailers shrinking footprints by approximately 2% per year. For office, one major metro area saw vacancies hit 14% in April 2025, yet office-using sectors gained 197,000 jobs nationally over the last year, suggesting a demand floor. Industrial demand showed resilience, with Q3 2025 net absorption reaching 45.1 million square feet, a 33% year-over-year increase.
You should note the concentration of Generation Income Properties, Inc. (GIPR)'s revenue stream. The top five tenants, including General Services Administration and Dollar General, collectively contributed approximately 59% of the portfolio's annualized base rent as of September 30, 2025.
Generation Income Properties, Inc. (GIPR) - Porter's Five Forces: Threat of new entrants
You're analyzing the competitive landscape for Generation Income Properties, Inc. (GIPR) as of late 2025, and the threat of new entrants is a key lever to watch. The ease with which new capital can flood into the net lease space directly impacts GIPR's market position.
- - Low barrier for private equity funds to raise capital and target net lease assets.
Honestly, the capital raising environment for private equity targeting real estate is showing a strong rebound. Private CRE funds are on pace to top $129 billion by December 2025, marking a 38% increase over 2024 totals. This influx of dry powder means more capital is actively seeking deployment. To be fair, the focus is shifting; real assets, which includes real estate, jumped to account for 26% of U.S. private capital raised in H1 2025, up from 19% the prior year. Large players are closing massive funds, with Brookfield's Strategic Real Estate Partners V reaching $16 billion and Carlyle's Realty Partners X closing at $9 billion in H1 2025.
This environment creates a direct threat because these large pools of capital are looking for the same stable, single-tenant net lease assets that Generation Income Properties, Inc. (GIPR) focuses on. New entrants benefit from GIPR's current liquidity challenge of only $282 thousand cash (Q3 2025), especially when compared to their total mortgage loans, net of $55.8 million as of September 30, 2025.
- - High current interest rates increase the cost of capital, deterring some new entrants.
Still, the cost of debt acts as a significant counterweight. Borrowing costs remain historically elevated compared to the ultra-low rate era. The target federal funds rate is projected at 3.9% by late 2025. However, commercial mortgage rates as of November 26, 2025, start at 5.14%. In early 2025, many market rates were in the 6% and 7% range, which severely restricted cash flow for properties. This higher cost of capital forces new entrants to underwrite deals at higher cap rates or contribute more equity, which can slow down their acquisition pace.
Here's a quick look at how the market environment stacks up against Generation Income Properties, Inc. (GIPR)'s own metrics:
| Metric | Market/External Data (Late 2025) | Generation Income Properties, Inc. (GIPR) Data (Q3 2025) |
| Cash Position | N/A | $282 thousand |
| Total Debt (Net) | N/A | $55.8 million |
| CRE Private Fund Capital Pace (2025) | Pace to raise $129 billion | N/A |
| Commercial Mortgage Rate (Starting) | As low as 5.14% | N/A |
| Investment Grade Tenant Rent Share | N/A | 60% of Annualized Rent |
- - The regulatory compliance and complexity of the REIT structure create a moderate barrier.
The structure itself imposes rules that new, non-REIT entrants might avoid. To maintain its tax benefits, Generation Income Properties, Inc. (GIPR) must adhere to strict IRS tests. Specifically, at the close of each quarter, at least 75% of its assets must be in real estate, cash, or government securities. Furthermore, the entity must distribute at least 90% of its taxable income as dividends. This mandatory payout structure limits retained capital for growth or defense. State-level disclosures, known as Blue Sky Laws, add another layer of regulatory burden.
- - New entrants benefit from GIPR's current liquidity challenge of only $282 thousand cash (Q3 2025).
The tight liquidity position of Generation Income Properties, Inc. (GIPR) is a clear vulnerability. With only $282 thousand in cash as of September 30, 2025, the company has limited immediate resources to counter aggressive acquisition bids from well-capitalized private equity funds. Conversely, Generation Income Properties, Inc. (GIPR) does have contractual resilience built into its leases; approximately 92% of leases provide for contractual base rent increases in future years.
Disclaimer
All information, articles, and product details provided on this website are for general informational and educational purposes only. We do not claim any ownership over, nor do we intend to infringe upon, any trademarks, copyrights, logos, brand names, or other intellectual property mentioned or depicted on this site. Such intellectual property remains the property of its respective owners, and any references here are made solely for identification or informational purposes, without implying any affiliation, endorsement, or partnership.
We make no representations or warranties, express or implied, regarding the accuracy, completeness, or suitability of any content or products presented. Nothing on this website should be construed as legal, tax, investment, financial, medical, or other professional advice. In addition, no part of this site—including articles or product references—constitutes a solicitation, recommendation, endorsement, advertisement, or offer to buy or sell any securities, franchises, or other financial instruments, particularly in jurisdictions where such activity would be unlawful.
All content is of a general nature and may not address the specific circumstances of any individual or entity. It is not a substitute for professional advice or services. Any actions you take based on the information provided here are strictly at your own risk. You accept full responsibility for any decisions or outcomes arising from your use of this website and agree to release us from any liability in connection with your use of, or reliance upon, the content or products found herein.