
|
Golden Matrix Group, Inc. (GMGI) Évaluation DCF |
Entièrement Modifiable: Adapté À Vos Besoins Dans Excel Ou Sheets
Conception Professionnelle: Modèles Fiables Et Conformes Aux Normes Du Secteur
Pré-Construits Pour Une Utilisation Rapide Et Efficace
Compatible MAC/PC, entièrement débloqué
Aucune Expertise N'Est Requise; Facile À Suivre
Golden Matrix Group, Inc. (GMGI) Bundle
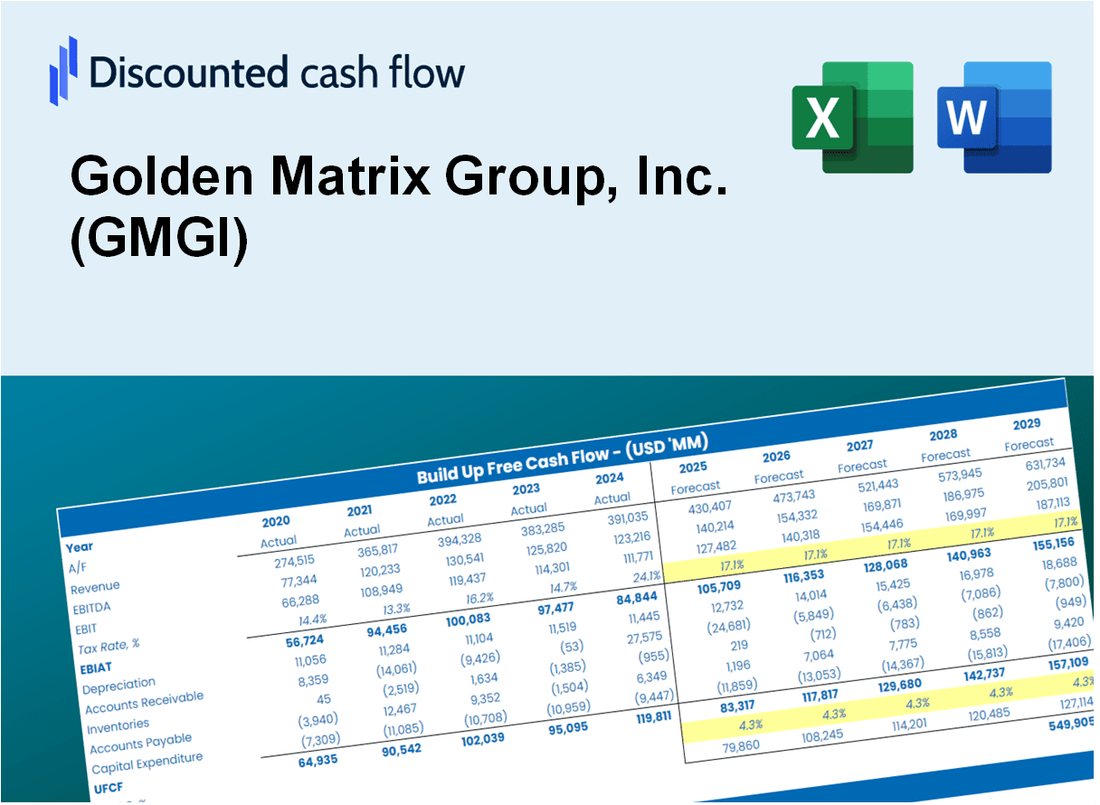
Que vous soyez un investisseur ou un analyste, cette calculatrice DCF (GMGI) est votre ressource incontournable pour une évaluation précise. Équipé de données réelles de Golden Matrix Group, Inc., vous pouvez ajuster les prévisions et observer les effets en temps réel.
What You Will Get
- Editable Forecast Inputs: Easily modify key assumptions (growth %, margins, WACC) to explore various scenarios.
- Real-World Data: Golden Matrix Group, Inc.'s (GMGI) financial data pre-loaded to enhance your analysis.
- Automatic DCF Outputs: The template computes Net Present Value (NPV) and intrinsic value automatically.
- Customizable and Professional: A refined Excel model tailored to meet your valuation requirements.
- Built for Analysts and Investors: Perfect for evaluating projections, confirming strategies, and increasing efficiency.
Key Features
- Customizable Growth Assumptions: Adjust essential inputs such as user acquisition rates, revenue per user, and operational costs.
- Instant Valuation Calculations: Provides real-time assessments of intrinsic value, NPV, and additional financial metrics.
- High-Precision Modeling: Leverages Golden Matrix Group's (GMGI) actual financial data for accurate valuation results.
- Effortless Scenario Testing: Easily explore various assumptions and analyze the resulting financial impacts.
- Efficiency-Boosting Solution: Streamlines the valuation process, removing the need for intricate model development.
How It Works
- Step 1: Download the prebuilt Excel template featuring Golden Matrix Group, Inc. (GMGI) data.
- Step 2: Navigate through the pre-filled sheets to familiarize yourself with the essential metrics.
- Step 3: Modify forecasts and assumptions in the editable yellow cells (WACC, growth, margins).
- Step 4: Instantly observe recalculated results, including Golden Matrix Group, Inc.'s (GMGI) intrinsic value.
- Step 5: Make well-informed investment decisions or create reports based on the outputs.
Why Choose This Calculator for Golden Matrix Group, Inc. (GMGI)?
- User-Friendly Interface: Perfectly crafted for both novices and seasoned professionals.
- Customizable Inputs: Adjust parameters easily to suit your financial analysis.
- Real-Time Feedback: Monitor immediate changes to GMGI’s valuation as you tweak inputs.
- Pre-Loaded Data: Comes with GMGI’s actual financial metrics for swift evaluations.
- Relied Upon by Experts: A favorite among investors and analysts for making strategic decisions.
Who Should Use Golden Matrix Group, Inc. (GMGI)?
- Gaming Enthusiasts: Discover innovative gaming solutions and stay updated on industry trends.
- Developers: Utilize GMGI's technology to enhance your gaming projects and applications.
- Investors: Analyze market performance and investment opportunities within the gaming sector.
- Entrepreneurs: Learn from GMGI's business model to inspire your own ventures in the gaming industry.
- Market Researchers: Gain insights into consumer behavior and gaming market dynamics through GMGI's data.
What the Template Contains
- Pre-Filled Data: Includes Golden Matrix Group, Inc.'s (GMGI) historical financials and forecasts.
- Discounted Cash Flow Model: Editable DCF valuation model with automatic calculations tailored for GMGI.
- Weighted Average Cost of Capital (WACC): A dedicated sheet for calculating WACC based on custom inputs specific to GMGI.
- Key Financial Ratios: Analyze Golden Matrix Group, Inc.'s (GMGI) profitability, efficiency, and leverage.
- Customizable Inputs: Edit revenue growth, margins, and tax rates for GMGI effortlessly.
- Clear Dashboard: Charts and tables summarizing key valuation results for Golden Matrix Group, Inc. (GMGI).
Disclaimer
All information, articles, and product details provided on this website are for general informational and educational purposes only. We do not claim any ownership over, nor do we intend to infringe upon, any trademarks, copyrights, logos, brand names, or other intellectual property mentioned or depicted on this site. Such intellectual property remains the property of its respective owners, and any references here are made solely for identification or informational purposes, without implying any affiliation, endorsement, or partnership.
We make no representations or warranties, express or implied, regarding the accuracy, completeness, or suitability of any content or products presented. Nothing on this website should be construed as legal, tax, investment, financial, medical, or other professional advice. In addition, no part of this site—including articles or product references—constitutes a solicitation, recommendation, endorsement, advertisement, or offer to buy or sell any securities, franchises, or other financial instruments, particularly in jurisdictions where such activity would be unlawful.
All content is of a general nature and may not address the specific circumstances of any individual or entity. It is not a substitute for professional advice or services. Any actions you take based on the information provided here are strictly at your own risk. You accept full responsibility for any decisions or outcomes arising from your use of this website and agree to release us from any liability in connection with your use of, or reliance upon, the content or products found herein.