
|
GOHEALTH, Inc. (GoCo) Valation DCF |
Entièrement Modifiable: Adapté À Vos Besoins Dans Excel Ou Sheets
Conception Professionnelle: Modèles Fiables Et Conformes Aux Normes Du Secteur
Pré-Construits Pour Une Utilisation Rapide Et Efficace
Compatible MAC/PC, entièrement débloqué
Aucune Expertise N'Est Requise; Facile À Suivre
GoHealth, Inc. (GOCO) Bundle
Gagnez la maîtrise sur votre analyse d'évaluation Gohealth, Inc. (GoCo) à l'aide de notre calculatrice sophistiquée DCF! Équipée de données réelles (goco), ce modèle Excel vous permet d'ajuster les prévisions et les hypothèses pour un calcul précis de la valeur intrinsèque de Gohealth, Inc.
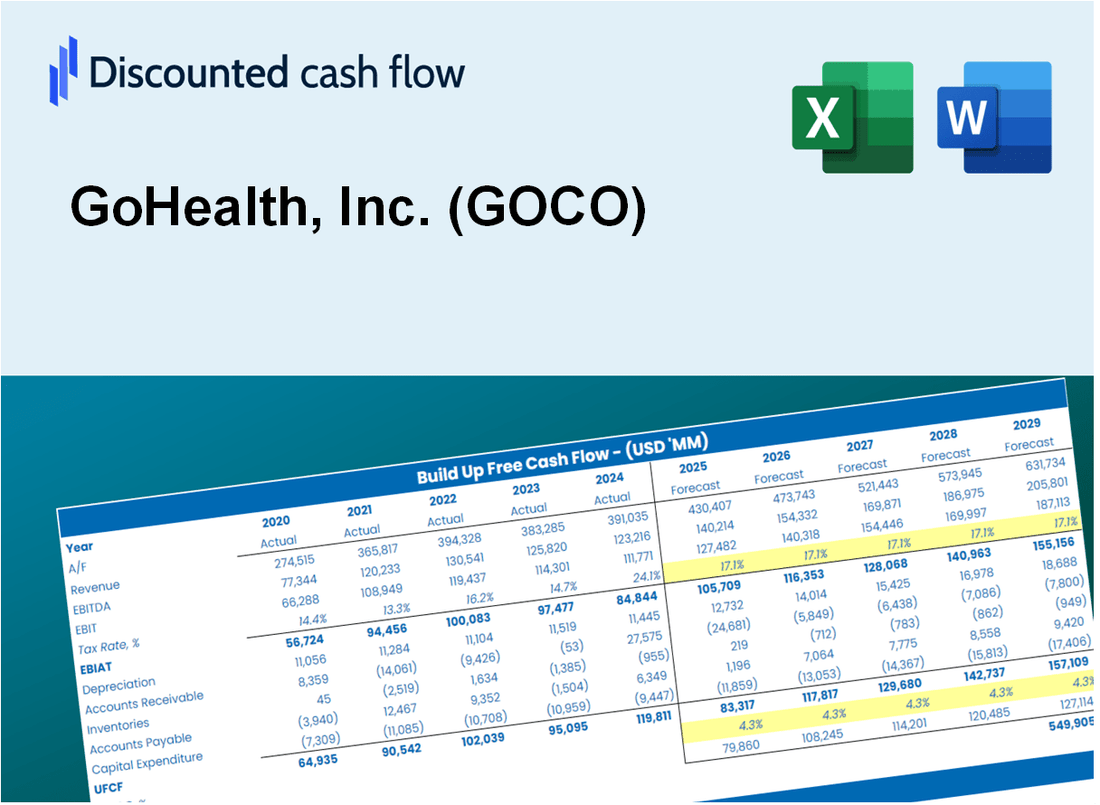
Discounted Cash Flow (DCF) - (USD MM)
| Year | AY1 2020 |
AY2 2021 |
AY3 2022 |
AY4 2023 |
AY5 2024 |
FY1 2025 |
FY2 2026 |
FY3 2027 |
FY4 2028 |
FY5 2029 |
|---|---|---|---|---|---|---|---|---|---|---|
| Revenue | 877.4 | 1,062.4 | 631.7 | 734.7 | 798.9 | 810.1 | 821.4 | 832.9 | 844.6 | 856.4 |
| Revenue Growth, % | 0 | 21.09 | -40.54 | 16.31 | 8.74 | 1.4 | 1.4 | 1.4 | 1.4 | 1.4 |
| EBITDA | 34.4 | -393.2 | -211.5 | 24.1 | 173.7 | -67.3 | -68.3 | -69.2 | -70.2 | -71.2 |
| EBITDA, % | 3.92 | -37.01 | -33.49 | 3.28 | 21.74 | -8.31 | -8.31 | -8.31 | -8.31 | -8.31 |
| Depreciation | 98.6 | 107.5 | 107.0 | 105.7 | 105.9 | 106.8 | 108.3 | 109.8 | 111.4 | 112.9 |
| Depreciation, % | 11.23 | 10.12 | 16.94 | 14.39 | 13.25 | 13.19 | 13.19 | 13.19 | 13.19 | 13.19 |
| EBIT | -64.2 | -500.7 | -318.6 | -81.6 | 67.8 | -174.2 | -176.6 | -179.1 | -181.6 | -184.1 |
| EBIT, % | -7.32 | -47.13 | -50.43 | -11.11 | 8.49 | -21.5 | -21.5 | -21.5 | -21.5 | -21.5 |
| Total Cash | 144.2 | 84.4 | 16.5 | 90.8 | 40.9 | 72.0 | 73.1 | 74.1 | 75.1 | 76.2 |
| Total Cash, percent | .0 | .0 | .0 | .0 | .0 | .0 | .0 | .0 | .0 | .0 |
| Account Receivables | 205.7 | 285.9 | 340.5 | 336.5 | 324.9 | 309.0 | 313.3 | 317.7 | 322.2 | 326.7 |
| Account Receivables, % | 23.45 | 26.91 | 53.9 | 45.8 | 40.66 | 38.15 | 38.15 | 38.15 | 38.15 | 38.15 |
| Inventories | .0 | .0 | .0 | .0 | .0 | .0 | .0 | .0 | .0 | .0 |
| Inventories, % | 0 | 0 | 0 | 0 | 0 | 0 | 0 | 0 | 0 | 0 |
| Accounts Payable | 87.2 | 144.0 | 137.2 | 136.4 | 113.4 | 126.3 | 128.1 | 129.9 | 131.7 | 133.5 |
| Accounts Payable, % | 9.94 | 13.55 | 21.72 | 18.57 | 14.19 | 15.59 | 15.59 | 15.59 | 15.59 | 15.59 |
| Capital Expenditure | -14.5 | -19.8 | -13.5 | -13.7 | -13.7 | -15.0 | -15.2 | -15.4 | -15.6 | -15.8 |
| Capital Expenditure, % | -1.66 | -1.86 | -2.14 | -1.87 | -1.72 | -1.85 | -1.85 | -1.85 | -1.85 | -1.85 |
| Tax Rate, % | 42.04 | 42.04 | 42.04 | 42.04 | 42.04 | 42.04 | 42.04 | 42.04 | 42.04 | 42.04 |
| EBITAT | -29.2 | -177.5 | -126.1 | -34.2 | 39.3 | -76.8 | -77.9 | -78.9 | -80.0 | -81.2 |
| Depreciation | ||||||||||
| Changes in Account Receivables | ||||||||||
| Changes in Inventories | ||||||||||
| Changes in Accounts Payable | ||||||||||
| Capital Expenditure | ||||||||||
| UFCF | -63.7 | -113.2 | -94.0 | 61.1 | 120.0 | 43.9 | 12.7 | 12.9 | 13.1 | 13.3 |
| WACC, % | 6.53 | 5.2 | 5.74 | 6.04 | 8.16 | 6.33 | 6.33 | 6.33 | 6.33 | 6.33 |
| PV UFCF | ||||||||||
| SUM PV UFCF | 83.3 | |||||||||
| Long Term Growth Rate, % | 2.00 | |||||||||
| Free cash flow (T + 1) | 14 | |||||||||
| Terminal Value | 312 | |||||||||
| Present Terminal Value | 230 | |||||||||
| Enterprise Value | 313 | |||||||||
| Net Debt | 487 | |||||||||
| Equity Value | -174 | |||||||||
| Diluted Shares Outstanding, MM | 10 | |||||||||
| Equity Value Per Share | -17.44 |
What You Will Get
- Editable Forecast Inputs: Easily modify assumptions (growth %, margins, WACC) to explore various scenarios.
- Real-World Data: GoHealth, Inc.'s (GOCO) financial data pre-filled to kickstart your analysis.
- Automatic DCF Outputs: The template computes Net Present Value (NPV) and intrinsic value for you.
- Customizable and Professional: A refined Excel model that adjusts to your valuation requirements.
- Built for Analysts and Investors: Perfect for testing projections, validating strategies, and enhancing efficiency.
Key Features
- Customizable Forecast Inputs: Adjust essential metrics such as revenue growth, EBITDA %, and operating expenses.
- Instant DCF Valuation: Quickly computes intrinsic value, NPV, and various financial outputs.
- High-Precision Accuracy: Leverages GoHealth’s actual financial data for credible valuation results.
- Effortless Scenario Analysis: Evaluate different scenarios and analyze results with ease.
- Efficiency Booster: Remove the hassle of constructing intricate valuation models from the ground up.
How It Works
- 1. Open the Template: Download and access the Excel file featuring GoHealth, Inc.'s (GOCO) preloaded data.
- 2. Edit Assumptions: Modify essential inputs such as growth rates, WACC, and capital expenditures.
- 3. View Results Instantly: The DCF model automatically calculates the intrinsic value and NPV.
- 4. Test Scenarios: Evaluate various forecasts to explore different valuation possibilities.
- 5. Use with Confidence: Present expert valuation insights to enhance your decision-making process.
Why Choose This Calculator for GoHealth, Inc. (GOCO)?
- Comprehensive Tool: Combines DCF, WACC, and financial ratio analyses tailored for GoHealth.
- Customizable Inputs: Modify yellow-highlighted cells to explore different financial scenarios.
- Detailed Insights: Automatically computes GoHealth’s intrinsic value and Net Present Value.
- Preloaded Data: Historical and projected data provide reliable starting points for analysis.
- Professional Quality: Perfect for financial analysts, investors, and business consultants focusing on GoHealth.
Who Should Use This Product?
- Investors: Accurately estimate GoHealth, Inc.'s (GOCO) fair value before making investment decisions.
- CFOs: Leverage a professional-grade DCF model for financial reporting and analysis specific to GoHealth, Inc. (GOCO).
- Consultants: Quickly adapt the template for valuation reports tailored to GoHealth, Inc. (GOCO) clients.
- Entrepreneurs: Gain insights into financial modeling practices utilized by leading health technology companies like GoHealth, Inc. (GOCO).
- Educators: Use it as a teaching tool to demonstrate valuation methodologies relevant to the healthcare sector, including GoHealth, Inc. (GOCO).
What the Template Contains
- Preloaded GOCO Data: Historical and projected financial data, including revenue, EBIT, and capital expenditures.
- DCF and WACC Models: Professional-grade sheets for calculating intrinsic value and Weighted Average Cost of Capital.
- Editable Inputs: Yellow-highlighted cells for adjusting revenue growth, tax rates, and discount rates.
- Financial Statements: Comprehensive annual and quarterly financials for deeper analysis.
- Key Ratios: Profitability, leverage, and efficiency ratios to evaluate performance.
- Dashboard and Charts: Visual summaries of valuation outcomes and assumptions.
Disclaimer
All information, articles, and product details provided on this website are for general informational and educational purposes only. We do not claim any ownership over, nor do we intend to infringe upon, any trademarks, copyrights, logos, brand names, or other intellectual property mentioned or depicted on this site. Such intellectual property remains the property of its respective owners, and any references here are made solely for identification or informational purposes, without implying any affiliation, endorsement, or partnership.
We make no representations or warranties, express or implied, regarding the accuracy, completeness, or suitability of any content or products presented. Nothing on this website should be construed as legal, tax, investment, financial, medical, or other professional advice. In addition, no part of this site—including articles or product references—constitutes a solicitation, recommendation, endorsement, advertisement, or offer to buy or sell any securities, franchises, or other financial instruments, particularly in jurisdictions where such activity would be unlawful.
All content is of a general nature and may not address the specific circumstances of any individual or entity. It is not a substitute for professional advice or services. Any actions you take based on the information provided here are strictly at your own risk. You accept full responsibility for any decisions or outcomes arising from your use of this website and agree to release us from any liability in connection with your use of, or reliance upon, the content or products found herein.