
|
GOGO Inc. (GOGO) VALUATION DCF |
Entièrement Modifiable: Adapté À Vos Besoins Dans Excel Ou Sheets
Conception Professionnelle: Modèles Fiables Et Conformes Aux Normes Du Secteur
Pré-Construits Pour Une Utilisation Rapide Et Efficace
Compatible MAC/PC, entièrement débloqué
Aucune Expertise N'Est Requise; Facile À Suivre
Gogo Inc. (GOGO) Bundle
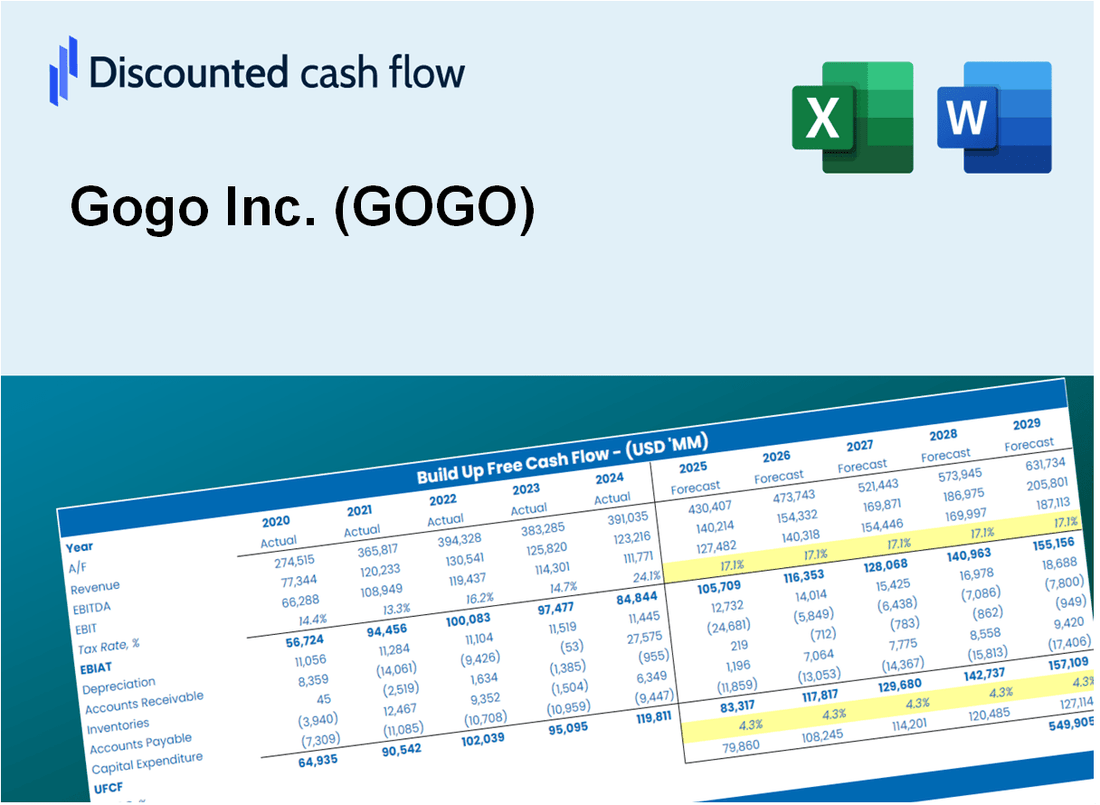
Découvrez le véritable potentiel de Gogo Inc. (GOGO) avec notre calculatrice avancée DCF! Personnalisez les hypothèses essentielles, explorez divers scénarios et évaluez comment les fluctuations affectent l'évaluation de Gogo Inc. (GOGO) - le tout dans un modèle Excel pratique.
What You Will Get
- Editable Excel Template: A fully customizable Excel-based DCF Calculator featuring pre-filled real GOGO financials.
- Real-World Data: Historical data and forward-looking estimates (as indicated in the yellow cells).
- Forecast Flexibility: Adjust forecast assumptions such as revenue growth, EBITDA %, and WACC.
- Automatic Calculations: Instantly observe the effects of your inputs on Gogo Inc.'s valuation.
- Professional Tool: Designed for investors, CFOs, consultants, and financial analysts.
- User-Friendly Design: Organized for clarity and ease of use, complete with step-by-step instructions.
Key Features
- Real-Time GOGO Data: Pre-loaded with Gogo Inc.'s historical performance metrics and future growth estimates.
- Customizable Assumptions: Modify parameters such as revenue growth rates, profit margins, discount rates, tax implications, and capital investments.
- Interactive Valuation Tool: Instant recalibrations of Net Present Value (NPV) and intrinsic value based on your custom inputs.
- Multiple Scenario Analysis: Develop various forecasting scenarios to evaluate different valuation possibilities.
- Intuitive User Interface: Designed to be accessible for both seasoned professionals and newcomers.
How It Works
- Download the Template: Gain immediate access to the Excel-based Gogo Inc. (GOGO) DCF Calculator.
- Input Your Assumptions: Modify the yellow-highlighted cells for growth rates, WACC, margins, and other variables.
- Instant Calculations: The model will automatically refresh Gogo Inc.'s (GOGO) intrinsic value.
- Test Scenarios: Experiment with different assumptions to assess potential changes in valuation.
- Analyze and Decide: Utilize the findings to inform your investment or financial analysis.
Why Choose This Calculator for Gogo Inc. (GOGO)?
- Accurate Data: Utilize real Gogo Inc. financials for dependable valuation outcomes.
- Customizable: Tailor essential parameters like growth rates, WACC, and tax rates to fit your forecasts.
- Time-Saving: Pre-built calculations save you from starting from the ground up.
- Professional-Grade Tool: Crafted for investors, analysts, and consultants in the telecommunications sector.
- User-Friendly: An intuitive design and step-by-step guidance make it accessible for all users.
Who Should Use This Product?
- Professional Investors: Develop comprehensive and trustworthy valuation models for analyzing Gogo Inc. (GOGO) stock.
- Corporate Finance Teams: Evaluate valuation scenarios to inform strategic decisions within the organization.
- Consultants and Advisors: Deliver precise valuation insights to clients focused on Gogo Inc. (GOGO).
- Students and Educators: Utilize real-world data to enhance learning and practice in financial modeling.
- Tech Enthusiasts: Gain insights into how telecommunications companies like Gogo Inc. (GOGO) are assessed in the market.
What the Template Contains
- Historical Data: Includes Gogo Inc.’s past financials and baseline forecasts.
- DCF and Levered DCF Models: Detailed templates to calculate Gogo Inc.’s intrinsic value.
- WACC Sheet: Pre-built calculations for Weighted Average Cost of Capital.
- Editable Inputs: Modify key drivers like growth rates, EBITDA %, and CAPEX assumptions.
- Quarterly and Annual Statements: A complete breakdown of Gogo Inc.’s financials.
- Interactive Dashboard: Visualize valuation results and projections dynamically.
Disclaimer
All information, articles, and product details provided on this website are for general informational and educational purposes only. We do not claim any ownership over, nor do we intend to infringe upon, any trademarks, copyrights, logos, brand names, or other intellectual property mentioned or depicted on this site. Such intellectual property remains the property of its respective owners, and any references here are made solely for identification or informational purposes, without implying any affiliation, endorsement, or partnership.
We make no representations or warranties, express or implied, regarding the accuracy, completeness, or suitability of any content or products presented. Nothing on this website should be construed as legal, tax, investment, financial, medical, or other professional advice. In addition, no part of this site—including articles or product references—constitutes a solicitation, recommendation, endorsement, advertisement, or offer to buy or sell any securities, franchises, or other financial instruments, particularly in jurisdictions where such activity would be unlawful.
All content is of a general nature and may not address the specific circumstances of any individual or entity. It is not a substitute for professional advice or services. Any actions you take based on the information provided here are strictly at your own risk. You accept full responsibility for any decisions or outcomes arising from your use of this website and agree to release us from any liability in connection with your use of, or reliance upon, the content or products found herein.