
|
U.S. Global Investors, Inc. (Grow) Valation DCF |
Entièrement Modifiable: Adapté À Vos Besoins Dans Excel Ou Sheets
Conception Professionnelle: Modèles Fiables Et Conformes Aux Normes Du Secteur
Pré-Construits Pour Une Utilisation Rapide Et Efficace
Compatible MAC/PC, entièrement débloqué
Aucune Expertise N'Est Requise; Facile À Suivre
U.S. Global Investors, Inc. (GROW) Bundle
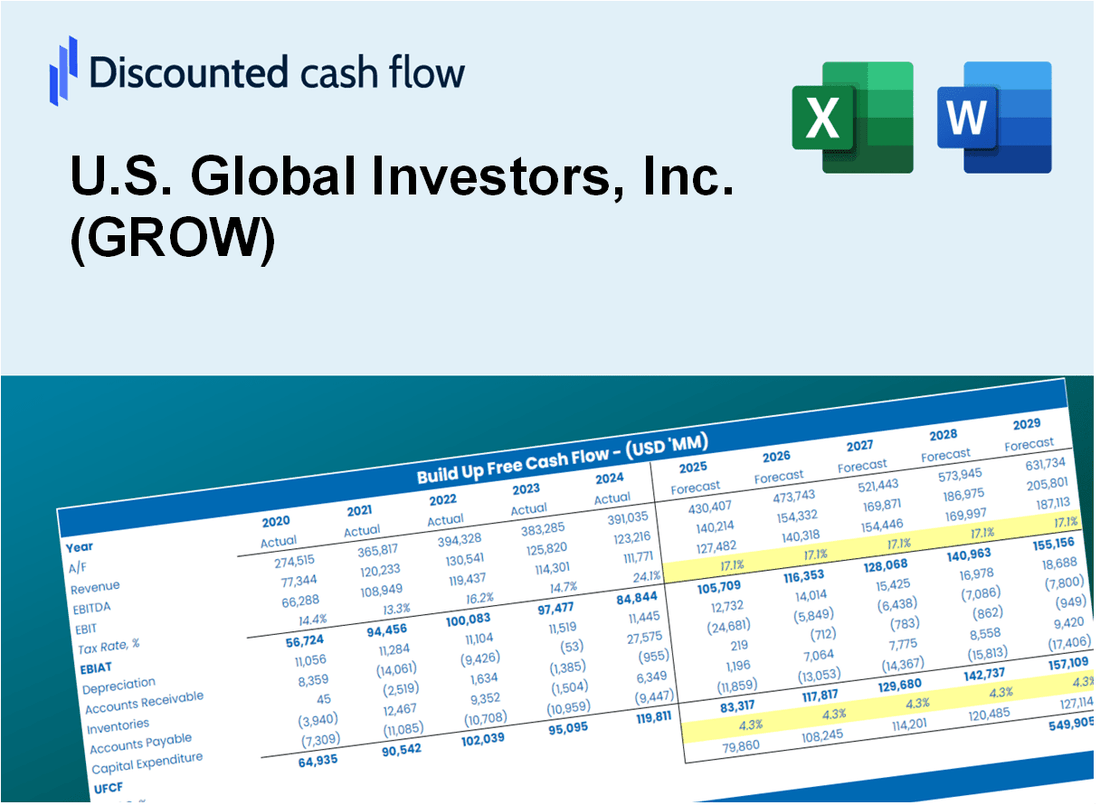
Explorez les perspectives financières de l'US Global Investors, Inc. (Grow) avec notre calculatrice DCF conviviale! Entrez vos hypothèses concernant la croissance, les marges et les dépenses pour calculer la valeur intrinsèque de l'US Global Investors, Inc. (Grow) et informer votre stratégie d'investissement.
Discounted Cash Flow (DCF) - (USD MM)
| Year | AY1 2021 |
AY2 2022 |
AY3 2023 |
AY4 2024 |
AY5 2025 |
FY1 2026 |
FY2 2027 |
FY3 2028 |
FY4 2029 |
FY5 2030 |
|---|---|---|---|---|---|---|---|---|---|---|
| Revenue | 21.7 | 24.7 | 15.1 | 11.0 | 8.5 | 6.9 | 5.6 | 4.5 | 3.7 | 3.0 |
| Revenue Growth, % | 0 | 14.13 | -39.01 | -27.13 | -23.05 | -18.76 | -18.76 | -18.76 | -18.76 | -18.76 |
| EBITDA | 8.5 | 3.5 | 2.5 | 2.1 | -3.0 | .7 | .6 | .5 | .4 | .3 |
| EBITDA, % | 39.43 | 14.02 | 16.76 | 19.25 | -35.33 | 10.82 | 10.82 | 10.82 | 10.82 | 10.82 |
| Depreciation | .4 | .2 | .2 | .2 | .0 | .1 | .1 | .1 | .0 | .0 |
| Depreciation, % | 1.73 | 0.91446 | 1.61 | 1.78 | 0 | 1.21 | 1.21 | 1.21 | 1.21 | 1.21 |
| EBIT | 8.2 | 3.2 | 2.3 | 1.9 | -3.0 | .7 | .5 | .4 | .4 | .3 |
| EBIT, % | 37.71 | 13.1 | 15.15 | 17.46 | -35.33 | 9.62 | 9.62 | 9.62 | 9.62 | 9.62 |
| Total Cash | 20.8 | 34.5 | 37.0 | 37.0 | 24.6 | 6.8 | 5.5 | 4.5 | 3.7 | 3.0 |
| Total Cash, percent | .0 | .0 | .0 | .0 | .0 | .0 | .0 | .0 | .0 | .0 |
| Account Receivables | 4.7 | 2.2 | 1.8 | 1.8 | 1.0 | 1.0 | .8 | .6 | .5 | .4 |
| Account Receivables, % | 21.62 | 8.82 | 12.08 | 16.17 | 12.26 | 14.19 | 14.19 | 14.19 | 14.19 | 14.19 |
| Inventories | .0 | .0 | .0 | .0 | .0 | .0 | .0 | .0 | .0 | .0 |
| Inventories, % | 0 | 0 | 0 | 0 | 0 | 0 | 0 | 0 | 0 | 0 |
| Accounts Payable | .6 | .9 | .6 | .5 | .0 | .2 | .2 | .1 | .1 | .1 |
| Accounts Payable, % | 2.55 | 3.52 | 4.17 | 4.63 | 0.11832 | 3 | 3 | 3 | 3 | 3 |
| Capital Expenditure | -.1 | -.2 | .0 | -.2 | .0 | .0 | .0 | .0 | .0 | .0 |
| Capital Expenditure, % | -0.33712 | -0.89018 | -0.09287515 | -1.94 | -0.08282063 | -0.66844 | -0.66844 | -0.66844 | -0.66844 | -0.66844 |
| Tax Rate, % | -27.48 | -27.48 | -27.48 | -27.48 | -27.48 | -27.48 | -27.48 | -27.48 | -27.48 | -27.48 |
| EBITAT | 7.0 | 2.2 | 1.8 | 1.3 | -3.8 | .5 | .4 | .3 | .3 | .2 |
| Depreciation | ||||||||||
| Changes in Account Receivables | ||||||||||
| Changes in Inventories | ||||||||||
| Changes in Accounts Payable | ||||||||||
| Capital Expenditure | ||||||||||
| UFCF | 3.1 | 5.1 | 2.1 | 1.2 | -3.6 | .8 | .6 | .5 | .4 | .3 |
| WACC, % | 8.87 | 8.87 | 8.87 | 8.87 | 8.87 | 8.87 | 8.87 | 8.87 | 8.87 | 8.87 |
| PV UFCF | ||||||||||
| SUM PV UFCF | 2.1 | |||||||||
| Long Term Growth Rate, % | 2.00 | |||||||||
| Free cash flow (T + 1) | 0 | |||||||||
| Terminal Value | 5 | |||||||||
| Present Terminal Value | 3 | |||||||||
| Enterprise Value | 5 | |||||||||
| Net Debt | -24 | |||||||||
| Equity Value | 30 | |||||||||
| Diluted Shares Outstanding, MM | 13 | |||||||||
| Equity Value Per Share | 2.23 |
What You Will Receive
- Authentic GROW Financial Data: Pre-filled with U.S. Global Investors' historical and projected data for accurate analysis.
- Completely Customizable Template: Easily adjust key inputs such as revenue growth, WACC, and EBITDA %.
- Instant Calculations: Watch U.S. Global Investors' intrinsic value update in real-time as you make changes.
- Expert Valuation Tool: Tailored for investors, analysts, and consultants aiming for precise DCF results.
- Intuitive Design: Clear layout and straightforward instructions suitable for all skill levels.
Key Features
- Comprehensive Data: U.S. Global Investors' historical financial statements and detailed forecasts.
- Customizable Parameters: Adjust WACC, tax rates, revenue growth, and EBITDA margins as needed.
- Real-Time Insights: View U.S. Global Investors' intrinsic value recalculated instantly.
- Intuitive Visualizations: Dashboard graphs illustrate valuation outcomes and essential metrics.
- Designed for Precision: A robust tool tailored for analysts, investors, and finance professionals.
How It Works
- Step 1: Download the Excel file.
- Step 2: Review pre-entered U.S. Global Investors, Inc. (GROW) data (historical and projected).
- Step 3: Adjust key assumptions (yellow cells) based on your analysis.
- Step 4: View automatic recalculations for U.S. Global Investors, Inc. (GROW)’s intrinsic value.
- Step 5: Use the outputs for investment decisions or reporting.
Why Choose This Calculator?
- Accurate Data: Real U.S. Global Investors, Inc. (GROW) financials ensure reliable valuation results.
- Customizable: Adjust key parameters like growth rates, WACC, and tax rates to match your projections.
- Time-Saving: Pre-built calculations eliminate the need to start from scratch.
- Professional-Grade Tool: Designed for investors, analysts, and consultants.
- User-Friendly: Intuitive layout and step-by-step instructions make it easy for all users.
Who Should Use This Product?
- Institutional Investors: Develop comprehensive investment strategies utilizing insights from U.S. Global Investors, Inc. (GROW).
- Wealth Management Advisors: Offer clients tailored investment solutions based on global market trends.
- Financial Analysts: Conduct in-depth research and analysis to inform investment decisions regarding U.S. Global Investors, Inc. (GROW).
- Students and Educators: Explore global investment concepts using real-time data for learning and teaching purposes.
- Global Market Enthusiasts: Gain a deeper understanding of how global investments are managed and valued.
What the Template Contains
- Pre-Filled DCF Model: U.S. Global Investors, Inc.’s (GROW) financial data preloaded for immediate use.
- WACC Calculator: Detailed calculations for Weighted Average Cost of Capital.
- Financial Ratios: Evaluate U.S. Global Investors, Inc.’s (GROW) profitability, leverage, and efficiency.
- Editable Inputs: Change assumptions such as growth, margins, and CAPEX to fit your scenarios.
- Financial Statements: Annual and quarterly reports to support detailed analysis.
- Interactive Dashboard: Easily visualize key valuation metrics and results.
Disclaimer
All information, articles, and product details provided on this website are for general informational and educational purposes only. We do not claim any ownership over, nor do we intend to infringe upon, any trademarks, copyrights, logos, brand names, or other intellectual property mentioned or depicted on this site. Such intellectual property remains the property of its respective owners, and any references here are made solely for identification or informational purposes, without implying any affiliation, endorsement, or partnership.
We make no representations or warranties, express or implied, regarding the accuracy, completeness, or suitability of any content or products presented. Nothing on this website should be construed as legal, tax, investment, financial, medical, or other professional advice. In addition, no part of this site—including articles or product references—constitutes a solicitation, recommendation, endorsement, advertisement, or offer to buy or sell any securities, franchises, or other financial instruments, particularly in jurisdictions where such activity would be unlawful.
All content is of a general nature and may not address the specific circumstances of any individual or entity. It is not a substitute for professional advice or services. Any actions you take based on the information provided here are strictly at your own risk. You accept full responsibility for any decisions or outcomes arising from your use of this website and agree to release us from any liability in connection with your use of, or reliance upon, the content or products found herein.