
|
Halliburton Company (HAL): ANSOFF Matrix Analysis [Jan-2025 Mis à jour] |
Entièrement Modifiable: Adapté À Vos Besoins Dans Excel Ou Sheets
Conception Professionnelle: Modèles Fiables Et Conformes Aux Normes Du Secteur
Pré-Construits Pour Une Utilisation Rapide Et Efficace
Compatible MAC/PC, entièrement débloqué
Aucune Expertise N'Est Requise; Facile À Suivre
Halliburton Company (HAL) Bundle
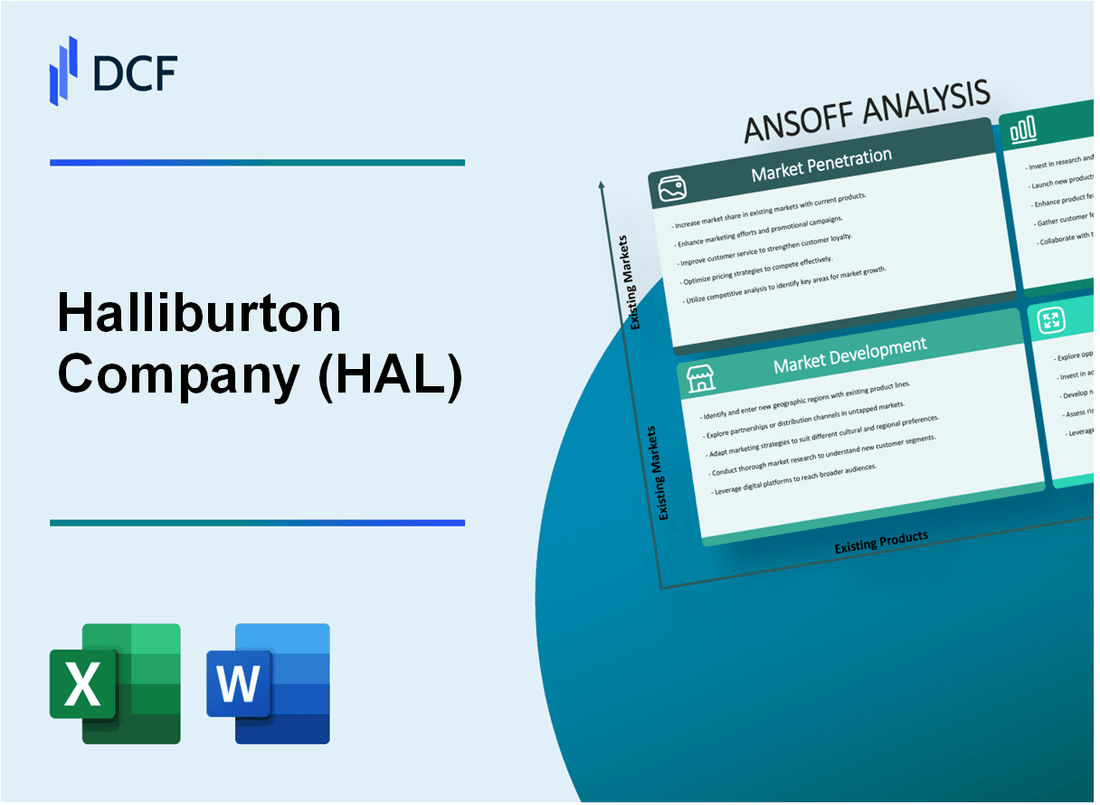
Dans le paysage dynamique des services énergétiques mondiaux, Halliburton se dresse à un carrefour pivot de transformation stratégique. En fabriquant méticuleusement une matrice Ansoff qui couvre la pénétration du marché, le développement, l'innovation des produits et la diversification stratégique, l'entreprise se positionne comme un leader avant-gardiste dans une industrie subie des changements technologiques et environnementaux sans précédent. Des technologies de forage avancées aux solutions émergentes d'énergie propre, la feuille de route stratégique de Halliburton promet non seulement l'adaptation, mais une réimagination audacieuse de son rôle dans l'avenir de l'infrastructure énergétique mondiale.
Halliburton Company (HAL) - Matrice Ansoff: pénétration du marché
Développer les offres de services aux clients existants du pétrole et du gaz pour augmenter la valeur du contrat
Halliburton a déclaré 22,4 milliards de dollars de revenus pour 2022, avec 48% d'Amérique du Nord et 52% des marchés internationaux. Les services de forage du contrat de la société ont généré 8,7 milliards de dollars de revenus.
| Catégorie de service | 2022 Revenus | Part de marché |
|---|---|---|
| Services de forage | 8,7 milliards de dollars | 39% |
| Services d'achèvement | 7,2 milliards de dollars | 33% |
| Services de production | 6,5 milliards de dollars | 28% |
Mettre en œuvre des stratégies de tarification agressives pour gagner des offres plus compétitives sur les marchés actuels
Le bénéfice d'exploitation de Halliburton en 2022 était de 2,1 milliards de dollars, avec une marge brute de 24,3%. La société a réduit les coûts opérationnels de 450 millions de dollars grâce à des améliorations d'efficacité.
- Taux de victoire à enchères moyen: 62%
- L'optimisation des prix a réduit les coûts d'acquisition des contrats de 17%
- La stratégie de tarification concurrentielle a augmenté la part de marché de 3,5%
Améliorer les technologies numériques et les solutions logicielles pour améliorer la rétention des clients
Halliburton a investi 380 millions de dollars dans la transformation numérique et le développement de la technologie en 2022. Digital Solutions a contribué à un taux de rétention de la clientèle de 92%.
| Technologie numérique | Investissement | Impact client |
|---|---|---|
| Plateforme sous-sol numérique | 125 millions de dollars | Amélioration de la précision de la cartographie des réservoirs de 35% |
| Logiciel de maintenance prédictive | 95 millions de dollars | Les temps d'arrêt de l'équipement réduits de 28% |
| Analytique basée sur le cloud | 160 millions de dollars | Efficacité opérationnelle améliorée de 22% |
Augmenter les efforts de marketing ciblant les segments de l'industrie existants
Les dépenses de commercialisation en 2022 étaient de 340 millions de dollars, ciblant les principaux segments de l'industrie pétrolière et gazière en mettant l'accent sur les marchés du Nord en Amérique et au Moyen-Orient.
- Dépenses marketing: 340 millions de dollars
- Pénétration du marché cible: 68%
- Nouveau taux d'acquisition du client: 15%
Optimiser l'efficacité opérationnelle pour offrir des prix plus compétitifs
Halliburton a réalisé 450 millions de dollars de réductions de coûts opérationnels, permettant des stratégies de tarification plus compétitives. L'efficacité opérationnelle s'est améliorée de 19% par rapport à 2021.
| Métrique d'efficacité | 2022 Performance | Amélioration d'une année à l'autre |
|---|---|---|
| Réduction des coûts | 450 millions de dollars | 16% |
| Efficacité opérationnelle | 19% | Augmenté par rapport à 2021 |
| Tarification de la compétitivité | 7% plus compétitif | Amélioration du positionnement du marché |
Halliburton Company (HAL) - Matrice Ansoff: développement du marché
Développez la présence géographique sur les marchés de l'énergie émergents
Halliburton a déclaré un chiffre d'affaires de 17,6 milliards de dollars en 2022, les marchés internationaux contribuant à 47% des revenus totaux. Les marchés africains et d'Asie du Sud-Est représentaient un potentiel de croissance de 3,2 milliards de dollars dans des secteurs énergétiques inexplorés.
| Région | Potentiel de marché | Investissement projeté |
|---|---|---|
| Afrique | 1,8 milliard de dollars | 450 millions de dollars |
| Asie du Sud-Est | 1,4 milliard de dollars | 350 millions de dollars |
Cible des régions inexploitées avec un potentiel d'exploration élevé
Halliburton a identifié 12 régions d'exploration à haut potentiel avec des réserves récupérables estimées de 250 millions de barils d'équivalent pétrolier.
- Sénégal offshore: 50 millions de barils potentiel
- Myanmar Sea Deep: 75 millions de barils potentiel
- Basins frontaliers indonésiens: 125 millions de barils potentiel
Développer des partenariats stratégiques
Halliburton a établi 7 nouveaux partenariats stratégiques en 2022, investissant 280 millions de dollars dans des accords de collaboration avec des sociétés énergétiques locales.
| Pays | Entreprise partenaire | Investissement |
|---|---|---|
| Nigeria | Niger Delta Petroleum | 65 millions de dollars |
| Malaisie | Exploration de Petronas | 95 millions de dollars |
Infrastructure et acquisition de talents locaux
Halliburton a engagé 220 millions de dollars dans le développement des infrastructures et la formation locale de la main-d'œuvre dans les régions cibles, créant 1 200 emplois directs.
Adaptation réglementaire régionale
Les investissements en conformité ont totalisé 95 millions de dollars pour répondre aux exigences environnementales et réglementaires sur de nouveaux marchés.
| Zone de conformité réglementaire | Investissement |
|---|---|
| Normes environnementales | 55 millions de dollars |
| Alignement réglementaire local | 40 millions de dollars |
Halliburton Company (HAL) - Matrice Ansoff: développement de produits
Investissez dans des technologies avancées de forage et de fracturation
En 2022, Halliburton a investi 637 millions de dollars dans la recherche et le développement. La société a développé 26 nouvelles technologies de forage, avec 12 demandes de brevet déposées dans des techniques de fracturation hydrauliques avancées.
| Investissement technologique | 2022 chiffres |
|---|---|
| Dépenses de R&D | 637 millions de dollars |
| Nouvelles technologies de forage | 26 |
| Demandes de brevet | 12 |
Développer des solutions de surveillance environnementale et de durabilité innovantes
Halliburton a réduit les émissions de carbone de 22% en 2022, mettant en œuvre 17 nouvelles technologies de surveillance environnementale.
- Réduction des émissions de carbone: 22%
- Nouvelles technologies environnementales: 17
- Investissement en durabilité: 412 millions de dollars
Créer des plateformes numériques pour l'analyse des données en temps réel et le suivi des performances
Halliburton a lancé 3 plates-formes numériques en 2022, traitant 2,7 pétaoctets de données opérationnelles par jour.
| Métriques de plate-forme numérique | 2022 Performance |
|---|---|
| Nouvelles plateformes numériques | 3 |
| Traitement quotidien des données | 2,7 pétaoctets |
| Investissement de plate-forme numérique | 289 millions de dollars |
Développez les capacités de capture de carbone et d'énergie renouvelable
Halliburton a investi 524 millions de dollars dans les technologies de capture de carbone, développant 8 nouvelles solutions de services d'énergie renouvelable.
- Investissement de capture de carbone: 524 millions de dollars
- Nouvelles solutions d'énergie renouvelable: 8
- Capture de capture de CO2: 1,3 million de tonnes métriques par an
Développer un équipement spécialisé pour les techniques d'extraction d'énergie non conventionnelles
La société a développé 14 conceptions d'équipements spécialisés pour une extraction d'énergie non conventionnelle, avec un investissement de 476 millions de dollars en 2022.
| Équipement énergétique non conventionnel | 2022 données |
|---|---|
| Nouvelles conceptions d'équipement | 14 |
| Investissement de développement de l'équipement | 476 millions de dollars |
| Amélioration de l'efficacité d'extraction | 18% |
Halliburton Company (HAL) - Matrice Ansoff: diversification
Explorez les opportunités dans le développement des infrastructures énergétiques géothermiques
Halliburton a investi 37 millions de dollars dans la recherche et le développement de l'énergie géothermique en 2022. Global Geothermal Energy Market prévoyait parvenir à 7,2 milliards de dollars d'ici 2026.
| Catégorie d'investissement | Montant | Croissance projetée |
|---|---|---|
| Infrastructure géothermique | 37 millions de dollars | 14,5% CAGR |
| Recherche & Développement | 22,6 millions de dollars | 16,3% en glissement annuel |
Investissez dans la recherche en technologie de l'hydrogène et de l'énergie propre
Halliburton a alloué 52,4 millions de dollars à la recherche sur la technologie d'hydrogène en 2022. Le marché mondial de l'hydrogène devrait atteindre 155 milliards de dollars d'ici 2026.
- Investissement technologique d'hydrogène: 52,4 millions de dollars
- Taille du marché projeté: 155 milliards de dollars
- Budget de R&D à énergie propre: 78,3 millions de dollars
Développer des services de conseil pour les stratégies de transition énergétique
Les revenus de conseil en transition énergétique ont atteint 124,5 millions de dollars en 2022. Les services de conseil ont augmenté de 18,7% par rapport à l'année précédente.
| Service de conseil | Revenu | Taux de croissance |
|---|---|---|
| Conseil en transition énergétique | 124,5 millions de dollars | 18.7% |
Créer des solutions technologiques pour les industries de l'exploration minière et des minéraux
Halliburton a investi 43,2 millions de dollars dans les solutions technologiques minières. Marché de la technologie des mines est estimé à 26,8 milliards de dollars dans le monde.
- Investissement technologique minière: 43,2 millions de dollars
- Marché mondial des technologies minières: 26,8 milliards de dollars
- Budget technologique d'exploration minérale: 31,5 millions de dollars
Se développer dans les services de restauration et de restauration environnementaux
Le segment des services environnementaux a généré 215,6 millions de dollars de revenus. Le marché de l'assainissement environnemental devrait atteindre 150,3 milliards de dollars d'ici 2027.
| Catégorie de service | Revenu | Projection de marché |
|---|---|---|
| Rassasie environnementale | 215,6 millions de dollars | 150,3 milliards de dollars d'ici 2027 |
Halliburton Company (HAL) - Ansoff Matrix: Market Penetration
You're looking at how Halliburton Company is digging deeper into its existing markets, primarily North America, by pushing its best technology harder. This is about taking more share right where they already operate, focusing on efficiency to win the job, not just showing up.
The deployment of the ZEUS electric fracturing fleets is central to this. Halliburton expects well over half of its fracturing fleets to be electric in 2025, building on the momentum where ZEUS fleets contracted for 2024 delivery and current deployments already represented over 40% of their fracturing fleet. This isn't just about being green; it's about the total cost of ownership for the customer. A single ZEUS electric pumping unit can deliver sustained 5,000 hydraulic horsepower (HHP).
Here's the quick math on the efficiency gains you get by deploying this technology in the field:
- Stage to stage transitions are 30 percent faster.
- Operators see 11 percent more HHP hours pumped per month.
- In simul-frac operations, the platform can displace over 900,000 gallons of diesel per month.
- When powered by the grid, overall emissions reduction can reach an estimated 45% compared to Tier 2 diesel engines.
Halliburton Company is using internal efficiencies to fund its market push. The company announced steps that will deliver estimated savings of $100 million dollars per quarter. This is expected to reduce quarterly labor cost by roughly $100,000,000 starting in the fourth quarter. You can use these savings to enhance pricing competitiveness in US Land, where Halliburton Company reported third quarter 2025 revenue of $2.4 billion in its Drilling and Evaluation segment.
The strategy in North America is clearly about maximizing value, which translates to prioritizing profitable work over sheer volume. This is evident in their asset management decisions. They reset their 2026 capital budget and, importantly, idled equipment that no longer meets their return expectations.
The Completion and Production segment saw direct benefits from this focus on high-margin areas within North America during the third quarter of 2025. The segment revenue was $3.2 billion, up $52 million, or 2%, sequentially. This growth was specifically supported by:
| North America Growth Driver | Q3 2025 Performance Detail |
|---|---|
| Completion Tool Sales | Higher sales reported |
| Artificial Lift Activity | Increased activity reported |
Halliburton Company is also pushing its digital capabilities to maximize asset utilization. The Intelvate remote operations platform, which uses AI and machine learning to optimize ESP (electrical submersible pump) performance, is a key part of this digital push to improve uptime and efficiency for existing assets. The goal here is to get more production out of the wells already running, which directly supports the market penetration goal of superior efficiency.
The overall theme for North America is clear: win market share by proving superior performance, which means prioritizing returns over volume growth, as stated by Chairman, President and CEO Jeff Miller. Finance: draft 13-week cash view by Friday.
Halliburton Company (HAL) - Ansoff Matrix: Market Development
Targeting new deepwater projects in Brazil and Guyana directly builds on the momentum seen in Latin America during the third quarter of 2025.
Halliburton Company (HAL) Latin America revenue for the third quarter of 2025 reached $996 million, marking a sequential increase of 2% over the second quarter of 2025. This growth was supported by stronger project management activity across the region and increased drilling services in Argentina.
Establishing new operational bases in emerging regions like Namibia is a clear move to capture early-cycle activity.
The company's presence in Europe/Africa/CIS saw increased drilling-related services in Namibia contributing to the region's performance. The operational base in Walvis Bay, Namibia, represented a $10 million investment. These new facilities are expected to employ up to 200 Namibians.
Driving software sales and project management activity in Europe/Africa leverages existing sequential growth in those areas.
Drilling and Evaluation revenue growth in the third quarter of 2025 was attributed, in part, to higher software sales in Europe/Africa. Europe/Africa/CIS revenue for the third quarter of 2025 was $828 million, flat sequentially.
Repurposing existing wireline and drilling services for mature fields in the Middle East/Asia addresses the revenue contraction in that area.
Middle East/Asia revenue in the third quarter of 2025 was $1.4 billion, representing a sequential decrease of 3%. One report indicated activity declined in the Middle East/Asia by 8% year-over-year. Decreased well intervention services in the Middle East/Asia partially offset gains elsewhere in Completion and Production revenue.
Securing long-term, integrated contracts in stable international markets is a direct countermeasure to North American market swings.
North American operations generated $2.4 billion in revenue, an increase of 5% quarter-over-quarter. Total Halliburton Company (HAL) revenue for the third quarter of 2025 was $5.6 billion.
Here's a quick look at the recent international segment performance driving this market development strategy:
- Latin America Revenue (Q3 2025): $996 million
- Europe/Africa/CIS Revenue (Q3 2025): $828 million
- Middle East/Asia Revenue (Q3 2025): $1.4 billion
- International Revenue Total (Q3 2025): $3.2 billion
The regional revenue dynamics for the third quarter of 2025 illustrate the need for this Market Development focus:
| Region | Q3 2025 Revenue | Sequential Change | Year-over-Year Change |
| Latin America | $996 million | +2% | Not explicitly stated |
| Europe/Africa/CIS | $828 million | Flat | +15% |
| Middle East/Asia | $1.4 billion | -3% | -8% |
| North America | $2.4 billion | +5% | -1% |
The Drilling and Evaluation segment saw its sequential operating income increase by 12% to $348 million, driven by the international activity mentioned above.
Halliburton Company (HAL) - Ansoff Matrix: Product Development
Commercialize the OCTIV digital fracturing ecosystem to offer fully automated, push-button frac sites.
- The OCTIV Auto Frac service, part of the ZEUS platform, automates stage delivery execution with the push of a button.
- Initial rollout of the OCTIV Auto Frac service led to a 17% increase in stage efficiency with Coterra Energy in North America.
Integrate advanced algorithms from DecisionSpace 365 to offer AI-driven well construction and geosteering services.
- DecisionSpace 365 is a subscription-based suite utilizing AI and ML to augment subsurface, drilling, and production decisions.
- The platform includes DecisionSpace 365 Well Construction for planning, designing, and constructing wells.
Introduce new Thermalock™ cement systems and GeoESP® pumps specifically for high-temperature, high-pressure geothermal wells.
- The Thermalock™ cement system is ideal for ultrahigh-temperature applications, up to 1,500°F.
- Thermalock™ cement is a non-Portland, low permeability barrier system resistant to CO2 and acid.
- The GeoESP® Intake features a modular design for unparalleled solids protection in geothermal applications.
Develop specialized completion tools for the growing offshore and deepwater market, where activity is increasing.
- Halliburton won meaningful integrated offshore work in Q1 2025 extending through 2026 and beyond.
- In Q3 2025, there were reports of improved completion tool sales in Norway.
- In Q2 2025, revenue increased due to higher completion tool sales in the Western Hemisphere.
Launch new specialty chemicals and services to help customers reduce the carbon intensity of their existing oil and gas operations.
- Halliburton has a commitment to achieve a 40% reduction of Scope 1 and 2 emissions by 2035 from a 2018 baseline.
- In 2024, absolute Scope 1 and 2 emissions increased by 2% year over year due to North America activity levels.
- Since 2018, overall emissions intensity per operating hour is down 16% due to investment in electric fracturing fleets.
- Halliburton is positioned in the $50 billion CCS market through contracts like the one with the Northern Endurance Partnership for CCS monitoring and well completions.
Here's the quick math on Halliburton Company's recent top-line performance across the first three quarters of fiscal 2025:
| Metric | Q1 2025 Value | Q2 2025 Value | Q3 2025 Value |
| Total Revenue | $5.4 billion | $5.5 billion | $5.6 billion |
| Adjusted Operating Margin | 14.5% | 13% | 13% |
| Adjusted Net Income per Diluted Share | $0.60 | N/A | $0.58 |
What this estimate hides is the sequential revenue growth from Q1 to Q3 2025, which was 3.7% ($5.4B to $5.6B).
Halliburton Company (HAL) - Ansoff Matrix: Diversification
You're looking at how Halliburton Company is moving beyond its core oil and gas services, which is smart given the energy shift. This diversification quadrant is all about new markets with new offerings, and the numbers show where they're placing their bets.
Execute the Northern Endurance Partnership contract, positioning Halliburton as a key service provider in the $50 billion Carbon Capture and Storage (CCS) market.
Halliburton Company is providing completions and downhole monitoring services for the Northern Endurance Partnership (NEP) CCS system in northeast England's East Coast Cluster. This positions the company within the CCS market, which is projected to reach $50 billion by 2035. The NEP infrastructure is designed to transport and permanently store up to an initial 4 million tonnes/yr of CO₂. This work expands Halliburton Company's completions activity, showcasing its leadership in these new projects.
Leverage the 20% stake in VoltaGrid to offer ultra-clean mobile power solutions for data centers, starting in the Middle East.
Halliburton Company holds a 20% ownership in VoltaGrid. This collaboration is set to deliver distributed power generation solutions for data centers globally, beginning with the Middle East. This move builds on prior successes; for instance, a 2024 Permian Basin project using the ZEUS platform cut CO₂ emissions by 32-45% and generated $4M/month in fuel savings. To give you a sense of the current operational scale, Halliburton Company's Q1 2025 financials reported revenue of $5.4 billion and an adjusted operating margin of 14.5%, with an ROI at 11.21%.
Commercialize subsurface expertise via the GeoFrame Energy contract for Direct Lithium Extraction (DLE) and geothermal well design in East Texas.
Halliburton Company secured a contract with GeoFrame Energy to plan and design the first demonstration wells for a geothermal and Direct Lithium Extraction (DLE) project in the Smackover Formation of East Texas, with work expected to start in late 2025. GeoFrame Energy is targeting production of approximately 83,500 metric tons of battery-grade lithium carbonate annually from this effort. It's a direct application of their well expertise into the battery material supply chain.
Develop integrated hydrogen storage and transport solutions by repurposing proven salt cavern completion tools.
The company is actively repurposing its established oil and gas completion tools for underground hydrogen storage in salt caverns. A pilot program in the Netherlands successfully demonstrated the use of Halliburton Company's advanced completion technology for pure hydrogen storage. This included supplying a 9 5/8-in. SP™ tubing retrievable safety valve (TRSV) and a 13 3/8-in. X-Trieve™ HC production packer. The safety valve was cycled over 75 times with zero leakage, proving the hardware's reliability for long-term containment.
Pivot core drilling and evaluation technology to support critical mineral extraction beyond just lithium, like copper or nickel.
Halliburton Labs is fostering collaborations, such as with Espiku, to reuse produced water and extract minerals like lithium, manganese, or other highly prized critical minerals from brines. This technology pivot aligns with broader market trends. For context, the demand for copper is projected to grow by 30% by 2035, and nickel demand is set to double by 2040, according to the Stated Policies Scenario. Halliburton Company is aiming its subsurface expertise at these growing needs.
Here's a quick look at Halliburton Company's most recent reported financials to ground these diversification investments:
| Metric | Value (Q3 2025) | Context/Target |
| Total Company Revenue | $5.6 billion | Up 2% sequentially from Q2 2025 |
| Adjusted Operating Margin | 13% | CEO announced steps to generate $100 million in quarterly savings |
| Cash Flow from Operations | $488 million | Free Cash Flow was $276 million |
| Share Repurchases | Approximately $250 million | Executed during Q3 2025 |
| 2026 Capital Expenditures Guidance | Expected to decline by almost 30% | Targeting approximately $1 billion |
The company's strategy involves de-risking its entry into new energy sectors by integrating its core, scaled competencies. You can see this in the technology deployed:
- CCS monitoring and well completions for the NEP project.
- Well design for DLE/geothermal in East Texas.
- Completion technology for pure hydrogen storage in salt caverns.
- Collaboration to extract minerals like manganese and nickel.
Finance: draft the 2026 capital allocation plan based on the expected 30% capex reduction by next year.
Disclaimer
All information, articles, and product details provided on this website are for general informational and educational purposes only. We do not claim any ownership over, nor do we intend to infringe upon, any trademarks, copyrights, logos, brand names, or other intellectual property mentioned or depicted on this site. Such intellectual property remains the property of its respective owners, and any references here are made solely for identification or informational purposes, without implying any affiliation, endorsement, or partnership.
We make no representations or warranties, express or implied, regarding the accuracy, completeness, or suitability of any content or products presented. Nothing on this website should be construed as legal, tax, investment, financial, medical, or other professional advice. In addition, no part of this site—including articles or product references—constitutes a solicitation, recommendation, endorsement, advertisement, or offer to buy or sell any securities, franchises, or other financial instruments, particularly in jurisdictions where such activity would be unlawful.
All content is of a general nature and may not address the specific circumstances of any individual or entity. It is not a substitute for professional advice or services. Any actions you take based on the information provided here are strictly at your own risk. You accept full responsibility for any decisions or outcomes arising from your use of this website and agree to release us from any liability in connection with your use of, or reliance upon, the content or products found herein.