
|
Hayward Holdings, Inc. (Hayw) Valation DCF |
Entièrement Modifiable: Adapté À Vos Besoins Dans Excel Ou Sheets
Conception Professionnelle: Modèles Fiables Et Conformes Aux Normes Du Secteur
Pré-Construits Pour Une Utilisation Rapide Et Efficace
Compatible MAC/PC, entièrement débloqué
Aucune Expertise N'Est Requise; Facile À Suivre
Hayward Holdings, Inc. (HAYW) Bundle
Conçu pour la précision, notre calculatrice DCF (HayW) vous permet d'évaluer Hayward Holdings, Inc. en utilisant des données financières réelles tout en offrant une flexibilité complète pour modifier tous les paramètres essentiels pour des projections améliorées.
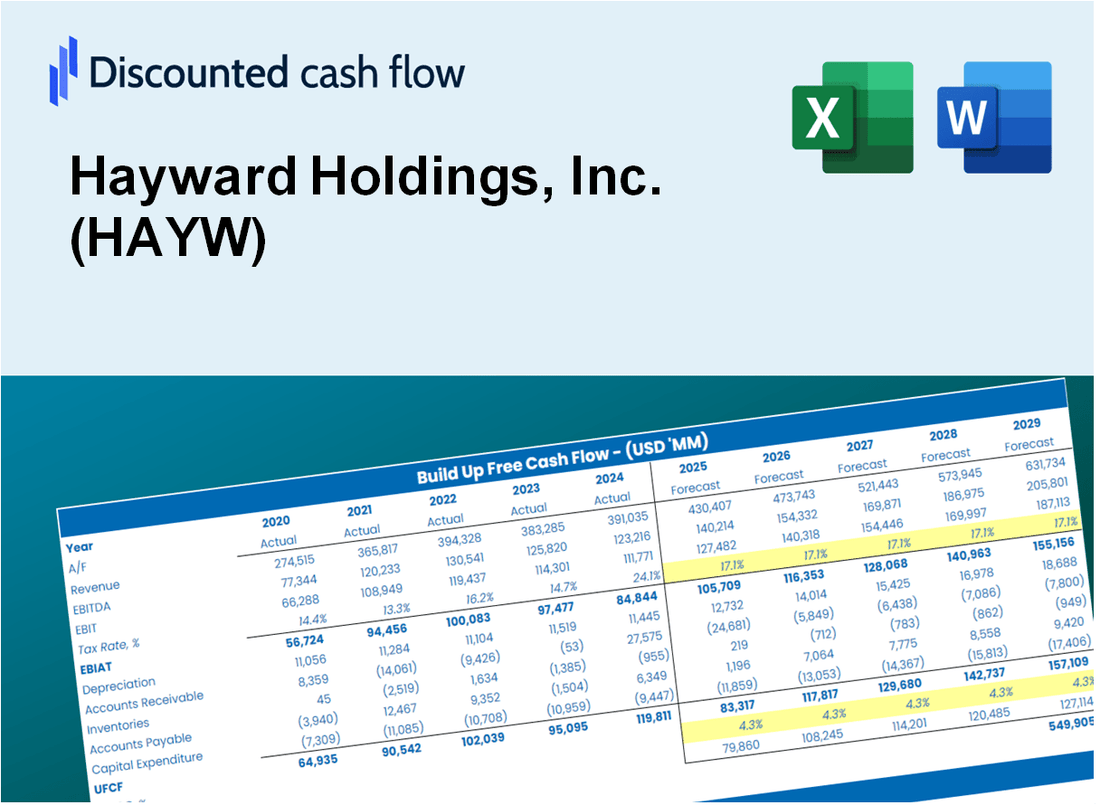
Discounted Cash Flow (DCF) - (USD MM)
| Year | AY1 2020 |
AY2 2021 |
AY3 2022 |
AY4 2023 |
AY5 2024 |
FY1 2025 |
FY2 2026 |
FY3 2027 |
FY4 2028 |
FY5 2029 |
|---|---|---|---|---|---|---|---|---|---|---|
| Revenue | 875.4 | 1,401.8 | 1,314.1 | 992.5 | 1,051.6 | 1,144.6 | 1,245.7 | 1,355.9 | 1,475.7 | 1,606.2 |
| Revenue Growth, % | 0 | 60.13 | -6.25 | -24.48 | 5.96 | 8.84 | 8.84 | 8.84 | 8.84 | 8.84 |
| EBITDA | 188.1 | 362.2 | 343.1 | 243.4 | 278.9 | 284.9 | 310.1 | 337.5 | 367.4 | 399.9 |
| EBITDA, % | 21.49 | 25.84 | 26.11 | 24.52 | 26.52 | 24.9 | 24.9 | 24.9 | 24.9 | 24.9 |
| Depreciation | 56.7 | 57.8 | 57.6 | 53.1 | 55.9 | 58.7 | 63.9 | 69.5 | 75.7 | 82.4 |
| Depreciation, % | 6.48 | 4.12 | 4.39 | 5.35 | 5.31 | 5.13 | 5.13 | 5.13 | 5.13 | 5.13 |
| EBIT | 131.4 | 304.4 | 285.4 | 190.3 | 223.0 | 226.2 | 246.2 | 268.0 | 291.7 | 317.5 |
| EBIT, % | 15.01 | 21.71 | 21.72 | 19.18 | 21.21 | 19.77 | 19.77 | 19.77 | 19.77 | 19.77 |
| Total Cash | 114.9 | 265.8 | 56.2 | 203.1 | 196.6 | 172.9 | 188.2 | 204.8 | 222.9 | 242.6 |
| Total Cash, percent | .0 | .0 | .0 | .0 | .0 | .0 | .0 | .0 | .0 | .0 |
| Account Receivables | 140.2 | 208.1 | 236.3 | 280.9 | 285.0 | 238.6 | 259.7 | 282.7 | 307.7 | 334.9 |
| Account Receivables, % | 16.02 | 14.85 | 17.98 | 28.3 | 27.1 | 20.85 | 20.85 | 20.85 | 20.85 | 20.85 |
| Inventories | 145.3 | 233.4 | 283.7 | 215.2 | 216.5 | 222.3 | 241.9 | 263.3 | 286.6 | 311.9 |
| Inventories, % | 16.6 | 16.65 | 21.59 | 21.68 | 20.58 | 19.42 | 19.42 | 19.42 | 19.42 | 19.42 |
| Accounts Payable | 74.0 | 87.4 | 54.0 | 68.9 | 81.5 | 76.7 | 83.5 | 90.8 | 98.9 | 107.6 |
| Accounts Payable, % | 8.45 | 6.24 | 4.11 | 6.95 | 7.75 | 6.7 | 6.7 | 6.7 | 6.7 | 6.7 |
| Capital Expenditure | -15.6 | -27.1 | -29.6 | -31.0 | -24.3 | -26.1 | -28.4 | -30.9 | -33.7 | -36.6 |
| Capital Expenditure, % | -1.78 | -1.94 | -2.25 | -3.12 | -2.31 | -2.28 | -2.28 | -2.28 | -2.28 | -2.28 |
| Tax Rate, % | 17.7 | 17.7 | 17.7 | 17.7 | 17.7 | 17.7 | 17.7 | 17.7 | 17.7 | 17.7 |
| EBITAT | 98.4 | 238.4 | 218.5 | 151.9 | 183.5 | 177.3 | 193.0 | 210.1 | 228.6 | 248.8 |
| Depreciation | ||||||||||
| Changes in Account Receivables | ||||||||||
| Changes in Inventories | ||||||||||
| Changes in Accounts Payable | ||||||||||
| Capital Expenditure | ||||||||||
| UFCF | -72.0 | 126.4 | 134.8 | 212.8 | 222.2 | 245.7 | 194.5 | 211.7 | 230.4 | 250.8 |
| WACC, % | 8.19 | 8.24 | 8.21 | 8.26 | 8.3 | 8.24 | 8.24 | 8.24 | 8.24 | 8.24 |
| PV UFCF | ||||||||||
| SUM PV UFCF | 896.7 | |||||||||
| Long Term Growth Rate, % | 3.00 | |||||||||
| Free cash flow (T + 1) | 258 | |||||||||
| Terminal Value | 4,930 | |||||||||
| Present Terminal Value | 3,319 | |||||||||
| Enterprise Value | 4,215 | |||||||||
| Net Debt | 779 | |||||||||
| Equity Value | 3,436 | |||||||||
| Diluted Shares Outstanding, MM | 221 | |||||||||
| Equity Value Per Share | 15.52 |
What You Will Get
- Pre-Filled Financial Model: Hayward's actual data allows for an accurate DCF valuation.
- Full Forecast Control: Modify revenue growth, profit margins, WACC, and other essential drivers.
- Instant Calculations: Real-time updates ensure you see the results as you make adjustments.
- Investor-Ready Template: A polished Excel file crafted for high-quality valuation.
- Customizable and Reusable: Designed for adaptability, enabling repeated use for comprehensive forecasts.
Key Features
- 🔍 Real-Life HAYW Financials: Pre-filled historical and projected data for Hayward Holdings, Inc.
- ✏️ Fully Customizable Inputs: Adjust all critical parameters (yellow cells) like WACC, growth %, and tax rates.
- 📊 Professional DCF Valuation: Built-in formulas calculate Hayward’s intrinsic value using the Discounted Cash Flow method.
- ⚡ Instant Results: Visualize Hayward’s valuation instantly after making changes.
- Scenario Analysis: Test and compare outcomes for various financial assumptions side-by-side.
How It Works
- Download: Obtain the pre-built Excel file featuring Hayward Holdings, Inc. (HAYW) financial data.
- Customize: Modify projections, such as revenue growth, EBITDA %, and WACC.
- Update Automatically: The intrinsic value and NPV calculations refresh in real-time.
- Test Scenarios: Generate various forecasts and instantly compare results.
- Make Decisions: Leverage the valuation findings to shape your investment approach.
Why Choose This Calculator for Hayward Holdings, Inc. (HAYW)?
- User-Friendly Interface: Crafted for both novices and seasoned professionals.
- Customizable Inputs: Effortlessly adjust parameters to suit your financial analysis.
- Real-Time Valuation: Observe immediate updates to Hayward's valuation as you modify the inputs.
- Pre-Loaded Data: Comes equipped with Hayward's actual financial statistics for swift evaluations.
- Endorsed by Experts: A preferred tool among investors and analysts for making well-informed choices.
Who Should Use This Product?
- Finance Students: Master valuation methods and apply them to real-world data with Hayward Holdings, Inc. (HAYW).
- Academics: Integrate industry-standard models into your lectures or research focusing on Hayward Holdings, Inc. (HAYW).
- Investors: Validate your investment hypotheses and assess valuation scenarios for Hayward Holdings, Inc. (HAYW).
- Analysts: Enhance your efficiency with a customizable DCF model tailored for Hayward Holdings, Inc. (HAYW).
- Small Business Owners: Understand the analytical approaches used for evaluating large public companies like Hayward Holdings, Inc. (HAYW).
What the Template Contains
- Historical Data: Includes Hayward Holdings, Inc.'s past financials and baseline forecasts.
- DCF and Levered DCF Models: Detailed templates to calculate Hayward Holdings, Inc.'s intrinsic value.
- WACC Sheet: Pre-built calculations for Weighted Average Cost of Capital.
- Editable Inputs: Modify key drivers like growth rates, EBITDA %, and CAPEX assumptions.
- Quarterly and Annual Statements: A complete breakdown of Hayward Holdings, Inc.'s financials.
- Interactive Dashboard: Visualize valuation results and projections dynamically.
Disclaimer
All information, articles, and product details provided on this website are for general informational and educational purposes only. We do not claim any ownership over, nor do we intend to infringe upon, any trademarks, copyrights, logos, brand names, or other intellectual property mentioned or depicted on this site. Such intellectual property remains the property of its respective owners, and any references here are made solely for identification or informational purposes, without implying any affiliation, endorsement, or partnership.
We make no representations or warranties, express or implied, regarding the accuracy, completeness, or suitability of any content or products presented. Nothing on this website should be construed as legal, tax, investment, financial, medical, or other professional advice. In addition, no part of this site—including articles or product references—constitutes a solicitation, recommendation, endorsement, advertisement, or offer to buy or sell any securities, franchises, or other financial instruments, particularly in jurisdictions where such activity would be unlawful.
All content is of a general nature and may not address the specific circumstances of any individual or entity. It is not a substitute for professional advice or services. Any actions you take based on the information provided here are strictly at your own risk. You accept full responsibility for any decisions or outcomes arising from your use of this website and agree to release us from any liability in connection with your use of, or reliance upon, the content or products found herein.