
|
Heritage Commerce Corp (HTBK) Évaluation DCF |
Entièrement Modifiable: Adapté À Vos Besoins Dans Excel Ou Sheets
Conception Professionnelle: Modèles Fiables Et Conformes Aux Normes Du Secteur
Pré-Construits Pour Une Utilisation Rapide Et Efficace
Compatible MAC/PC, entièrement débloqué
Aucune Expertise N'Est Requise; Facile À Suivre
Heritage Commerce Corp (HTBK) Bundle
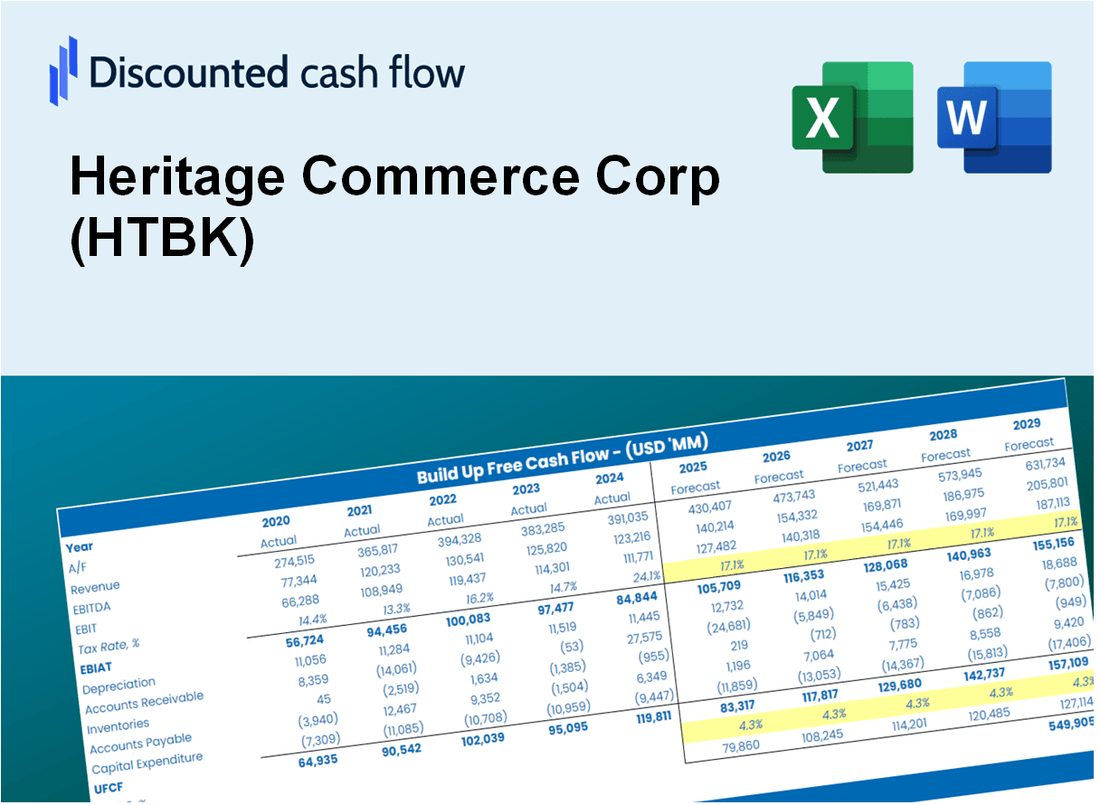
Évaluez les perspectives financières de Heritage Commerce Corp Corp (HTBK) avec une expertise! Cette calculatrice DCF (HTBK) fournit des données financières pré-remplies et offre une pleine flexibilité pour modifier la croissance des revenus, le WACC, les marges bénéficiaires et d'autres hypothèses essentielles pour s'aligner sur vos prévisions.
What You Will Receive
- Pre-Filled Financial Model: Heritage Commerce Corp’s (HTBK) actual data provides an accurate DCF valuation.
- Comprehensive Forecast Control: Modify revenue growth, profit margins, WACC, and other essential factors.
- Real-Time Calculations: Automatic updates allow you to view results instantly as adjustments are made.
- Professional-Grade Template: A polished Excel file crafted for high-quality valuation presentations.
- Flexible and Reusable: Designed for adaptability, enabling repeated application for thorough forecasts.
Key Features
- Authentic Heritage Commerce Data: Gain access to precise pre-loaded historical figures and future forecasts for Heritage Commerce Corp (HTBK).
- Adjustable Forecast Parameters: Modify yellow-highlighted fields such as WACC, growth rates, and profit margins.
- Real-Time Calculations: Automatic refresh of DCF, Net Present Value (NPV), and cash flow assessments.
- Interactive Dashboard: User-friendly charts and summaries to help visualize your valuation outcomes.
- Suitable for All Levels: A straightforward, intuitive layout designed for investors, CFOs, and consultants alike.
How It Works
- Step 1: Download the prebuilt Excel template featuring Heritage Commerce Corp's (HTBK) data.
- Step 2: Navigate through the pre-filled sheets to familiarize yourself with the essential metrics.
- Step 3: Modify forecasts and assumptions in the editable yellow cells (WACC, growth, margins).
- Step 4: Instantly view recalculated results, including Heritage Commerce Corp's (HTBK) intrinsic value.
- Step 5: Make informed investment decisions or create reports based on the outputs.
Why Choose This Calculator for Heritage Commerce Corp (HTBK)?
- Accuracy: Utilizes real Heritage Commerce Corp (HTBK) financials to ensure precise data.
- Flexibility: Tailored for users to easily test and adjust inputs as needed.
- Time-Saving: Avoid the complexities of building a DCF model from the ground up.
- Professional-Grade: Crafted with the precision and usability required by CFOs.
- User-Friendly: Accessible to all users, regardless of their financial modeling expertise.
Who Should Use This Product?
- Individual Investors: Make informed decisions about buying or selling Heritage Commerce Corp (HTBK) stock.
- Financial Analysts: Streamline valuation processes with ready-to-use financial models for Heritage Commerce Corp (HTBK).
- Consultants: Deliver professional valuation insights on Heritage Commerce Corp (HTBK) to clients quickly and accurately.
- Business Owners: Understand how companies like Heritage Commerce Corp (HTBK) are valued to guide your own strategy.
- Finance Students: Learn valuation techniques using real-world data and scenarios related to Heritage Commerce Corp (HTBK).
What the Template Contains
- Preloaded HTBK Data: Historical and projected financial data, including revenue, EBIT, and capital expenditures.
- DCF and WACC Models: Professional-grade sheets for calculating intrinsic value and Weighted Average Cost of Capital.
- Editable Inputs: Yellow-highlighted cells for adjusting revenue growth, tax rates, and discount rates.
- Financial Statements: Comprehensive annual and quarterly financials for deeper analysis.
- Key Ratios: Profitability, leverage, and efficiency ratios to evaluate performance.
- Dashboard and Charts: Visual summaries of valuation outcomes and assumptions.
Disclaimer
All information, articles, and product details provided on this website are for general informational and educational purposes only. We do not claim any ownership over, nor do we intend to infringe upon, any trademarks, copyrights, logos, brand names, or other intellectual property mentioned or depicted on this site. Such intellectual property remains the property of its respective owners, and any references here are made solely for identification or informational purposes, without implying any affiliation, endorsement, or partnership.
We make no representations or warranties, express or implied, regarding the accuracy, completeness, or suitability of any content or products presented. Nothing on this website should be construed as legal, tax, investment, financial, medical, or other professional advice. In addition, no part of this site—including articles or product references—constitutes a solicitation, recommendation, endorsement, advertisement, or offer to buy or sell any securities, franchises, or other financial instruments, particularly in jurisdictions where such activity would be unlawful.
All content is of a general nature and may not address the specific circumstances of any individual or entity. It is not a substitute for professional advice or services. Any actions you take based on the information provided here are strictly at your own risk. You accept full responsibility for any decisions or outcomes arising from your use of this website and agree to release us from any liability in connection with your use of, or reliance upon, the content or products found herein.