
|
Heritage Commerce Corp (HTBK): 5 Analyse des forces [Jan-2025 MISE À JOUR] |
Entièrement Modifiable: Adapté À Vos Besoins Dans Excel Ou Sheets
Conception Professionnelle: Modèles Fiables Et Conformes Aux Normes Du Secteur
Pré-Construits Pour Une Utilisation Rapide Et Efficace
Compatible MAC/PC, entièrement débloqué
Aucune Expertise N'Est Requise; Facile À Suivre
Heritage Commerce Corp (HTBK) Bundle
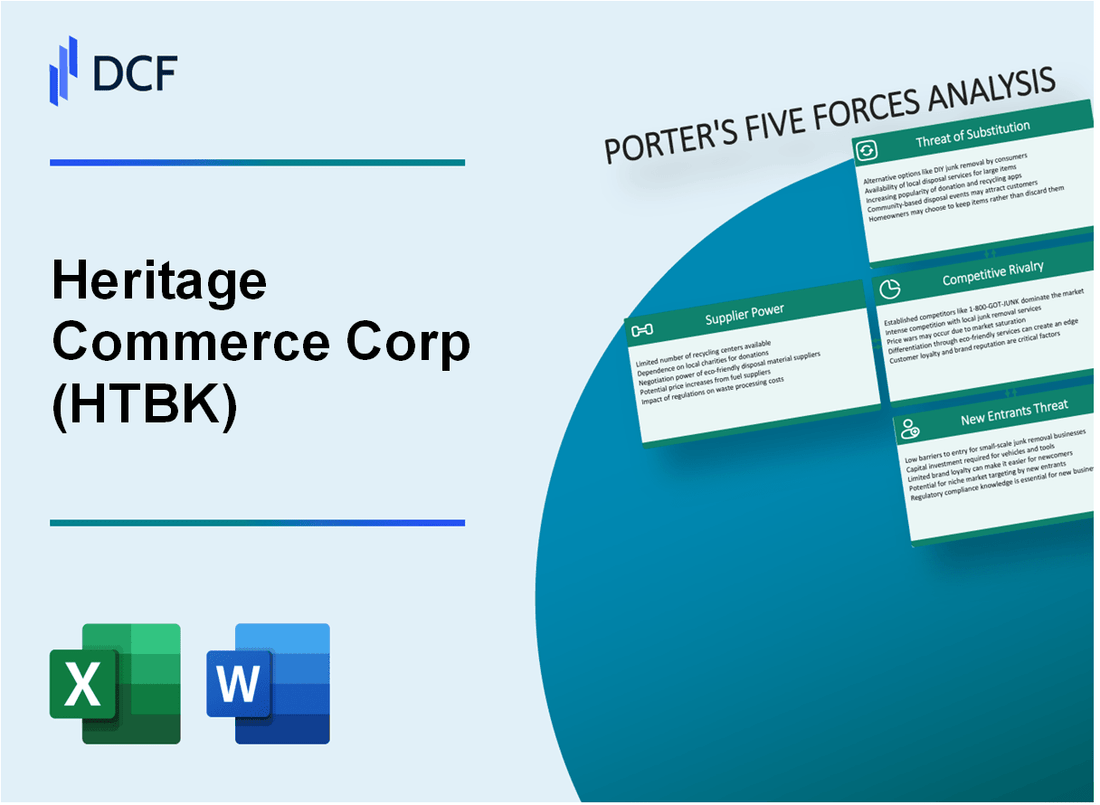
Dans le paysage dynamique de la banque régionale, Heritage Commerce Corp (HTBK) navigue dans un écosystème complexe de forces compétitives qui façonnent son positionnement stratégique. À mesure que la technologie financière évolue et que la dynamique du marché change, la compréhension de l'interaction complexe de la puissance des fournisseurs, des attentes des clients, de la rivalité concurrentielle, des substituts potentiels et des obstacles à l'entrée devient crucial pour une croissance durable et un avantage concurrentiel dans le secteur bancaire de la Silicon Valley.
Heritage Commerce Corp (HTBK) - Five Forces de Porter: Pouvoir de négociation des fournisseurs
Nombre limité de technologies bancaires de base et de fournisseurs de logiciels
En 2024, le marché de la technologie bancaire de base est dominé par quelques fournisseurs clés:
| Fournisseur | Part de marché | Revenus annuels |
|---|---|---|
| Finerv | 35.2% | 14,2 milliards de dollars |
| Jack Henry & Associés | 22.7% | 1,68 milliard de dollars |
| FIS Global | 28.5% | 12,6 milliards de dollars |
Coûts de commutation élevés pour les systèmes bancaires de base
Coûts de commutation estimés pour les systèmes bancaires de base:
- Coûts de mise en œuvre: 3,5 millions de dollars à 7,2 millions de dollars
- Temps de migration moyen: 18-24 mois
- Coûts de perturbation des entreprises potentielles: 1,2 million de dollars à 2,5 millions de dollars
Dépendance à l'égard des principaux fournisseurs de technologies
Brouchage du fournisseur de technologie du Heritage Commerce Corp:
| Catégorie de technologie | Vendeur principal | Dépenses technologiques annuelles |
|---|---|---|
| Plateforme bancaire de base | Finerv | 2,1 millions de dollars |
| Cybersécurité | Réseaux palo alto | $850,000 |
| Infrastructure cloud | Services Web Amazon | 1,4 million de dollars |
Potentiel de consolidation des vendeurs
Statistiques de consolidation des technologies financières:
- Transactions de fusions et acquisitions en 2023: 127 offres
- Valeur totale de la transaction: 18,3 milliards de dollars
- Taille moyenne de l'accord: 144 millions de dollars
Heritage Commerce Corp (HTBK) - Porter's Five Forces: Bargaining Power of Clients
Augmentation des attentes des clients pour les services bancaires numériques
Au quatrième trimestre 2023, le taux d'adoption des banques numériques de Heritage Commerce Corp a atteint 68,4% parmi sa clientèle. L'utilisation des banques mobiles a augmenté de 22,7% par rapport à l'année précédente.
| Métrique bancaire numérique | Pourcentage |
|---|---|
| Utilisateurs de la banque mobile | 68.4% |
| Croissance des transactions en ligne | 22.7% |
| Taux d'ouverture du compte numérique | 45.2% |
Faible coût de commutation pour les clients bancaires commerciaux et de détail
Le coût moyen du changement de banques sur le marché régional est d'environ 37,50 $ par client. Le taux de rétention de la clientèle pour Heritage Commerce Corp est de 73,6%.
- Temps de transfert de compte moyen: 5-7 jours ouvrables
- Frais de fermeture du compte typique: 25 $ - 50 $
- Traitement du transfert de dépôt direct: 14 jours
Sensibilité élevée au prix du marché bancaire régional concurrentiel
| Produit bancaire | Taux d'intérêt moyen | Sensibilité au prix du client |
|---|---|---|
| Comptes chèques | 0.15% | 82.3% |
| Comptes d'épargne | 0.45% | 76.5% |
| Prêts personnels | 7.25% | 68.9% |
Demande croissante de solutions financières personnalisées
Heritage Commerce Corp a indiqué que 54,3% des clients préfèrent les produits financiers personnalisés. Les demandes de services bancaires personnalisées ont augmenté de 37,6% en 2023.
- Demandes de conseils financiers personnalisés: 42,7%
- Demande de portefeuille d'investissement personnalisée: 38,9%
- Intérêts sur les produits de prêt sur mesure: 61,2%
Heritage Commerce Corp (HTBK) - Five Forces de Porter: Rivalité compétitive
Paysage de concurrence du marché
Depuis le quatrième trimestre 2023, Heritage Commerce Corp fait face à une concurrence intense dans la Silicon Valley et les marchés bancaires de la Californie du Nord avec 37 banques régionales opérant dans la même zone géographique.
| Concurrent | Part de marché | Actif total |
|---|---|---|
| Silicon Valley Bank | 12.4% | 209 milliards de dollars |
| First Republic Bank | 8.7% | 173 milliards de dollars |
| Heritage Commerce Corp | 3.2% | 6,8 milliards de dollars |
Facteurs de pression concurrentiels
- Marge d'intérêt net moyen pour les banques régionales: 3,1%
- Taux d'adoption des banques numériques: 68%
- Coût d'acquisition du client: 382 $ par nouveau compte
Le taux de consolidation des services bancaires régionaux en 2023 a atteint 14,6%, avec 22 transactions de fusion terminées dans le nord de la Californie.
Métriques d'investissement technologique
| Zone technologique | Investissement moyen | ROI attendu |
|---|---|---|
| Banque mobile | 2,3 millions de dollars | 17.5% |
| Cybersécurité | 1,7 million de dollars | 12.9% |
Heritage Commerce Corp (HTBK) - Five Forces de Porter: Menace de substituts
Rise des plateformes de bancs bancaires fintech et numériques
Au quatrième trimestre 2023, les plateformes bancaires numériques ont capturé 65,3% de la part de marché dans des services financiers alternatifs. PayPal a rapporté 435 millions d'utilisateurs actifs dans le monde. L'application en espèces de Square a traité 2,4 milliards de dollars de transactions au cours du troisième trimestre 2023.
| Plate-forme numérique | Total utilisateurs | Volume de transaction |
|---|---|---|
| Paypal | 435 millions | 1,36 billion de dollars (2023) |
| Application en espèces | 44 millions | 2,4 milliards de dollars (T3 2023) |
| Venmo | 85 millions | 960 milliards de dollars (2023) |
Applications bancaires mobiles
L'adoption des services bancaires mobiles a atteint 89% parmi les milléniaux en 2023. Chase Mobile App a rapporté 55 millions d'utilisateurs actifs. La plate-forme bancaire numérique de Bank of America a traité 2,1 milliards de transactions en 2023.
- Taux d'adoption des banques mobiles de 89% parmi les milléniaux
- 55 millions d'utilisateurs d'applications mobiles Chase
- 2,1 milliards de transactions numériques par Bank of America
Plateformes de prêt alternatives
Les plateformes de prêt en ligne ont créé 16,3 milliards de dollars de prêts en 2023. LendingClub a déclaré 4,2 milliards de dollars de prêts personnels. SOFI a traité 3,8 milliards de dollars de transactions de prêt alternatives.
| Plate-forme de prêt | Les prêts totaux ont été originaires | Part de marché |
|---|---|---|
| Club de prêt | 4,2 milliards de dollars | 26.7% |
| Sovi | 3,8 milliards de dollars | 23.5% |
Crypto-monnaie et systèmes de paiement numérique
La capitalisation boursière de la crypto-monnaie a atteint 1,7 billion de dollars en 2023. Le volume des transactions Bitcoin a dépassé 2,5 billions de dollars. Coinbase a rapporté 108 millions d'utilisateurs vérifiés.
- Caplette boursière de 1,7 billion de dollars à la crypto-monnaie
- 108 millions d'utilisateurs vérifiés Coinbase
- Volume de transaction Bitcoin de 2,5 billions de dollars
Heritage Commerce Corp (HTBK) - Five Forces de Porter: Menace de nouveaux entrants
Obstacles réglementaires élevés pour la création de nouvelles institutions bancaires
En 2024, la Réserve fédérale nécessite un ratio de capital minimum de 8% pour les nouvelles institutions bancaires. Le cadre réglementaire de Bâle III oblige un tampon de conservation du capital minimum de 2,5%, augmentant efficacement les exigences de capital total à 10,5%.
| Exigence réglementaire | Pourcentage |
|---|---|
| Ratio de capital minimum de niveau 1 | 8% |
| Tampon de conservation des capitaux | 2.5% |
| Exigence totale en capital | 10.5% |
Exigences de capital importantes pour l'entrée du marché
L'exigence de capital initiale moyenne pour une banque de novo en Californie est de 20 à 30 millions de dollars. Les coûts de conformité réglementaire peuvent varier de 500 000 $ à 2 millions de dollars par an pour une petite banque régionale.
- Capital initial minimum: 20 millions de dollars
- Capital initial maximum: 30 millions de dollars
- Coûts de conformité annuels: 500 000 $ - 2 millions de dollars
Conformité complexe et environnement réglementaire
La conformité à la Loi sur le réinvestissement communautaire (CRA) nécessite une documentation approfondie. Les banques sont confrontées en moyenne à 16 examens réglementaires différents par an, les amendes potentielles atteignant jusqu'à 1 million de dollars pour la non-conformité.
| Aspect réglementaire | Statistique |
|---|---|
| Examens réglementaires annuels | 16 |
| Fine de conformité potentielle maximale | $1,000,000 |
Les investissements technologiques nécessaires pour rivaliser efficacement
Les investissements en cybersécurité pour les banques régionales en moyenne 2,5 millions de dollars par an. Les coûts de développement de la plate-forme bancaire numérique varient de 3 à 5 millions de dollars pour la mise en œuvre initiale.
- Investissement annuel de cybersécurité: 2,5 millions de dollars
- Développement de la plate-forme bancaire numérique: 3 à 5 millions de dollars
- Développement d'applications bancaires mobiles: 500 000 $ - 1,2 million de dollars
Heritage Commerce Corp (HTBK) - Porter's Five Forces: Competitive rivalry
You're looking at the competitive intensity in the San Francisco Bay Area and Silicon Valley, and honestly, it's fierce. The concentration of financial institutions here means that Heritage Commerce Corp (HTBK) is constantly battling for market share. It's not just the local credit unions; the rivalry is high because the market includes massive national banks with deep pockets, plus aggressive regional players who know the local landscape well.
To give you a concrete sense of the competition, consider a peer like Hanmi Financial Corporation (HAFC). As of their Q3 2025 results, Hanmi Financial reported an efficiency ratio of 52.65%, which is notably lower than Heritage Commerce Corp's reported Q3 2025 efficiency ratio of 58.05%. That difference in cost management matters when pricing loans and deposits. Also, Hanmi operates 32 branches, giving them a wider physical footprint than Heritage Commerce Corp's 17 branches.
Heritage Commerce Corp counters this pressure by leaning hard into its community-focused, relationship-based model. That strategy is supported by its network of 17 branches across key Northern California communities, including San Jose, San Francisco, Oakland, and Walnut Creek. This localized approach is their primary differentiator against larger, less personal competitors.
The operational improvements in late 2025 show they are addressing the cost side of the rivalry equation. Heritage Commerce Corp's efficiency ratio improved to 58.05% for Q3 2025, down from 65.37% in Q3 2024. That's a significant step toward closing the gap with the most efficient regional rivals. Still, you have to watch the gap.
Here's a quick comparison of some Q3 2025 metrics between Heritage Commerce Corp and Hanmi Financial to map the competitive pressure:
| Metric | Heritage Commerce Corp (HTBK) Q3 2025 | Hanmi Financial (HAFC) Q3 2025 |
| Efficiency Ratio | 58.05% | 52.65% |
| Net Interest Margin (FTE/Reported) | 3.60% (FTE) | 3.22% (Reported) |
| Branch Count (Approximate) | 17 | 32 |
The rivalry forces Heritage Commerce Corp to focus on high-value activities. For instance, their Q3 2025 FTE Net Interest Margin of 3.60% shows strong pricing power on the asset side, which is essential when competing for deposits against peers who might have a larger, lower-cost deposit base. The improved efficiency ratio of 58.05% suggests better management of noninterest expense relative to revenue generation, which is a direct action against competitive margin compression.
You need to track loan production rates and deposit growth against these competitors. While Heritage Commerce Corp focuses on its relationship model, aggressive peers are scaling up their operations. Hanmi Financial, for example, saw loan production accelerate to $570.8 million in Q3 2025. That kind of volume in the market directly translates to more competition for quality loan opportunities for Heritage Commerce Corp.
Finance: draft a sensitivity analysis showing the impact of a 100-basis-point drop in NIM on the Q3 2025 efficiency ratio by Friday.
Heritage Commerce Corp (HTBK) - Porter's Five Forces: Threat of substitutes
You're looking at how outside-the-box alternatives are pulling business away from Heritage Commerce Corp, and honestly, the pressure is coming from several directions, especially as digital finance matures. The threat of substitutes is real because customers can often find faster, more tailored solutions elsewhere for both lending and deposit-taking.
Fintech lenders and payment platforms are strong substitutes for commercial services. These digital competitors are capturing market share by offering streamlined application processes and quicker funding decisions, which is a major draw for commercial clients needing immediate working capital. For context on the scale of this substitution, the Global Fintech Lending Market size was valued at approximately $589.64 billion in 2025, with nearly 68% of global borrowers preferring digital platforms for faster approvals. This shows a massive pool of potential commercial financing that bypasses traditional banks like Heritage Commerce Corp.
Money market funds and brokerages substitute for deposits, especially in a high-rate environment. When market rates are elevated, corporate treasurers and even high-net-worth individuals look past standard bank deposit accounts to earn higher yields, pulling cash out of Heritage Commerce Corp's balance sheet. As of September 30, 2025, Heritage Commerce Corp's total deposits stood at $4.8 billion, a figure constantly under pressure from higher-yielding alternatives. The competition for core deposits is fierce, forcing banks to pay more to retain funds, which directly impacts the net interest margin.
Factoring services, offered through Bay View Funding, partially mitigate substitution risk in that niche. While factoring is a substitute for traditional lines of credit or term loans, the fact that Heritage Commerce Corp has a dedicated offering through Bay View Funding helps retain some of that business. Bay View Funding can offer facilities up to $40 million, competing in a global factoring market estimated at $5.13 billion in 2025. This internal capability acts as a partial defense against pure-play third-party factors, though the overall factoring market is projected to grow to $12.41 billion by 2034.
Non-bank commercial real estate and construction financing options are readily available. This segment is a key area for Heritage Commerce Corp, where owner-occupied CRE loans represented 31% of the loan portfolio as of September 30, 2025. However, private debt funds and specialized non-bank lenders are increasingly active in this space, often offering speed or more flexible covenants than a regulated institution can provide. The availability of these alternatives means Heritage Commerce Corp must maintain competitive pricing and efficient underwriting to secure deals.
Here's a quick look at how the scale of the substitute markets compares to Heritage Commerce Corp's core business metrics as of late 2025:
| Substitute Category | Heritage Commerce Corp Metric (As of Q3 2025) | Substitute Market Size/Metric (2025 Data) |
| Fintech Lenders (Commercial) | Total Loans Held-for-Investment: $3.5 billion (6/30/25) | Global Fintech Lending Market Size: $589.64 billion (2025 Est.) |
| Deposit Competition (MMFs/Brokerages) | Total Deposits: $4.8 billion (9/30/25) | AI in Fintech Market Value: $30 billion (2025 Est.) |
| Factoring Niche (Bay View Funding) | Bay View Funding Facility Cap: Up to $40 million | Global Factoring Services Market Size: $5.13 billion (2025 Est.) |
| CRE Financing Competition | Owner Occupied CRE Loans: 31% of Portfolio (9/30/25) | Global Factoring Market Size (Alternative Measure): $4,732.30 Bn (2025 Est.) |
The loan to deposit ratio was 74.99% at September 30, 2025, indicating that while deposits are a focus, the loan book is well-funded, but the cost to maintain that funding against substitutes is a key variable. The bank's reported FTE net interest margin was 3.60% for the third quarter of 2025. If deposit competition from money market funds forces the cost of funds higher than the 1.54% seen in Q3 2025, that margin will compress.
The threat is not just about losing a loan or a deposit; it's about losing the entire client relationship to a platform that offers a superior digital experience. If onboarding takes 14+ days, churn risk rises defintely.
Finance: draft 13-week cash view by Friday.
Heritage Commerce Corp (HTBK) - Porter's Five Forces: Threat of new entrants
You're looking at the barriers to entry for new competitors trying to muscle in on Heritage Commerce Corp's turf, particularly in the relationship-focused SME space. Honestly, the threat level here is best pegged as moderate, largely because the hurdles to clear are substantial, especially for a full-service commercial bank.
The primary deterrent is the regulatory and capital gauntlet. To start a state bank in California, for example, applicants face stringent requirements. The Commissioner generally requires that initial shareholders' equity not be less than 10% of estimated total deposits projected for the end of the third year of business. Also, a new institution must hold between 8 and 10+% of its assets in fully-paid stock to cover startup costs and anticipated growth. You also need that charter from the state or federal government, plus FDIC insurance, which adds layers of administrative and financial commitment. These factors create a high barrier to entry for any group wanting to launch a traditional bank.
Consider the physical footprint needed to compete effectively in Heritage Commerce Corp's core market. Establishing a competitive branch network in the high-cost Bay Area is prohibitively expensive. While general freestanding branch construction costs can range from \$750,000 to \$5 million, land acquisition in urban centers like San Jose or San Francisco drives that number up significantly. To be fair, some digital-only entrants avoid this entirely, but for relationship banking, physical presence still matters. A proposed San Francisco Public Bank, for instance, explicitly planned not to open branches to reduce operating costs, signaling the expense involved.
Digital-only banks, or neobanks, can certainly enter the market with lower initial overhead, but they struggle to replicate the deep SME relationship model. While they offer digital onboarding and faster account openings, they often provide a narrow range of financial products, particularly lacking in complex loan and credit provisions that business owners need during difficult times. In the UK, for example, legacy financial institutions still hold well over 50% of SME deposits, showing the staying power of established trust. Neobanks face high customer acquisition costs and difficulty cross-selling, making it hard to convince an SME to switch its primary banking relationship.
Heritage Commerce Corp's own financial strength acts as a significant deterrent to destabilizing entrants. The Company's strong liquidity position provides a buffer against aggressive pricing wars or sudden market shifts. As of September 30, 2025, Heritage Commerce Corp's total available liquidity and borrowing capacity stood at \$3.3 billion. This substantial war chest, coupled with total assets of \$5.6 billion at that date, signals to potential competitors that Heritage Commerce Corp has the resources to defend its market share and continue investing in client relationships.
Here's a quick look at the key barriers and deterrents:
| Barrier/Deterrent Factor | Data Point/Requirement | Relevance to New Entrants |
|---|---|---|
| Regulatory Capitalization (CA Example) | Shareholders' Equity $\ge$ 10% of 3rd-year projected deposits | High initial capital commitment required for licensing. |
| General Branch Construction Cost | Average range of \$750,000 to \$5 million | Prohibitive expense for establishing a physical Bay Area footprint. |
| SME Market Share Held by Incumbents (UK Proxy) | Legacy banks hold over 50% of SME deposits | Indicates difficulty in displacing established trust and service models. |
| Heritage Commerce Corp Liquidity | Total Available Liquidity & Borrowing Capacity: \$3.3 billion (9/30/2025) | Acts as a strong financial deterrent against aggressive new competition. |
The path to entry is clearly defined by capital, regulatory compliance, and the need to build deep, trust-based SME relationships that digital platforms currently struggle to foster.
Disclaimer
All information, articles, and product details provided on this website are for general informational and educational purposes only. We do not claim any ownership over, nor do we intend to infringe upon, any trademarks, copyrights, logos, brand names, or other intellectual property mentioned or depicted on this site. Such intellectual property remains the property of its respective owners, and any references here are made solely for identification or informational purposes, without implying any affiliation, endorsement, or partnership.
We make no representations or warranties, express or implied, regarding the accuracy, completeness, or suitability of any content or products presented. Nothing on this website should be construed as legal, tax, investment, financial, medical, or other professional advice. In addition, no part of this site—including articles or product references—constitutes a solicitation, recommendation, endorsement, advertisement, or offer to buy or sell any securities, franchises, or other financial instruments, particularly in jurisdictions where such activity would be unlawful.
All content is of a general nature and may not address the specific circumstances of any individual or entity. It is not a substitute for professional advice or services. Any actions you take based on the information provided here are strictly at your own risk. You accept full responsibility for any decisions or outcomes arising from your use of this website and agree to release us from any liability in connection with your use of, or reliance upon, the content or products found herein.