
|
Interactive Brokers Group, Inc. (IBKR) Évaluation DCF |
Entièrement Modifiable: Adapté À Vos Besoins Dans Excel Ou Sheets
Conception Professionnelle: Modèles Fiables Et Conformes Aux Normes Du Secteur
Pré-Construits Pour Une Utilisation Rapide Et Efficace
Compatible MAC/PC, entièrement débloqué
Aucune Expertise N'Est Requise; Facile À Suivre
Interactive Brokers Group, Inc. (IBKR) Bundle
Rationalisez votre analyse et améliorez la précision avec notre calculatrice DCF (IBKR)! En utilisant des données en temps réel d'Interactive Brokers Group, Inc. et des hypothèses personnalisables, cet outil vous permet de prévoir, d'évaluer et de valoriser (IBKR) tout comme un investisseur chevronné.
What You Will Get
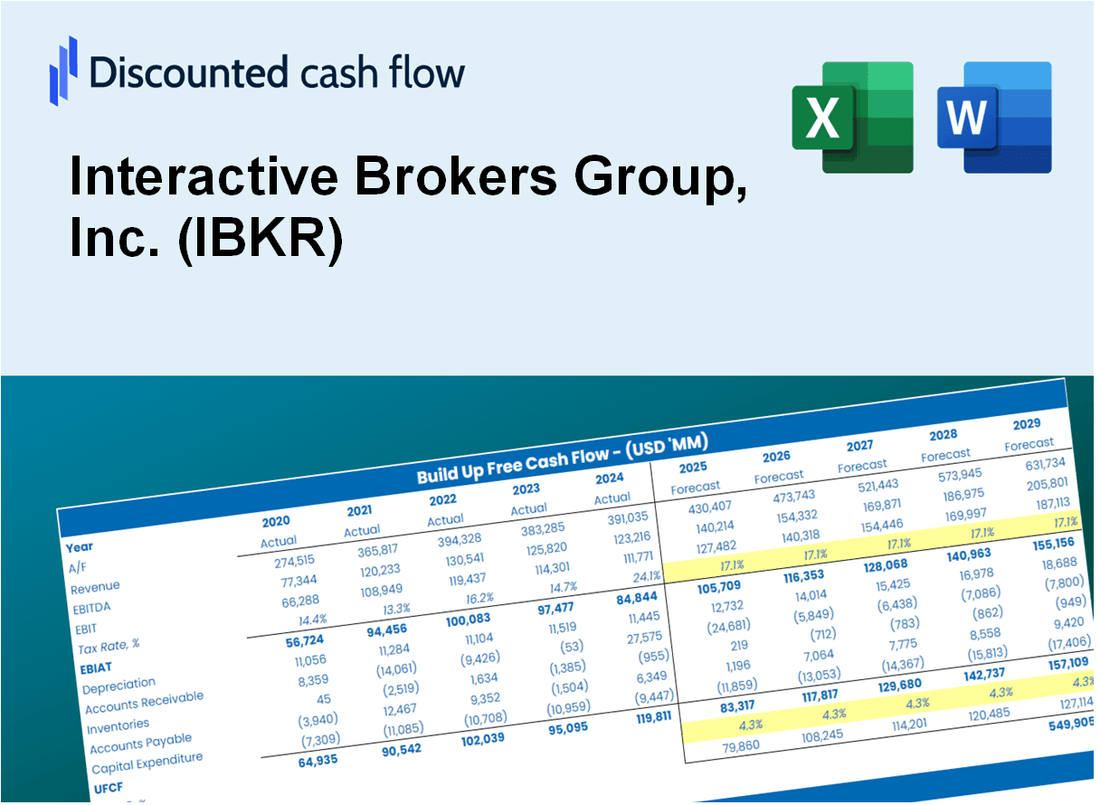
- Real Interactive Brokers Data: Preloaded financials – from revenue to EBIT – based on actual and projected figures for Interactive Brokers Group, Inc. (IBKR).
- Full Customization: Adjust all critical parameters (yellow cells) like WACC, growth %, and tax rates to fit your analysis needs.
- Instant Valuation Updates: Automatic recalculations to analyze the impact of changes on Interactive Brokers' fair value.
- Versatile Excel Template: Designed for quick edits, scenario testing, and detailed projections specific to Interactive Brokers Group, Inc. (IBKR).
- Time-Saving and Accurate: Eliminate the hassle of building models from scratch while ensuring precision and flexibility in your evaluations.
Key Features
- Comprehensive Market Data: Access Interactive Brokers’ extensive historical trading data and market analytics.
- Customizable Settings: Adjust leverage, margin requirements, commission structures, and risk parameters.
- Real-Time Updates: Monitor IBKR’s performance metrics and trading results instantly.
- User-Friendly Interface: Intuitive dashboards and charts for easy navigation and analysis.
- Designed for Professionals: A robust platform catering to traders, investors, and finance professionals.
How It Works
- Download the Template: Gain immediate access to the Excel-based IBKR DCF Calculator.
- Input Your Assumptions: Modify the yellow-highlighted cells for growth rates, WACC, margins, and other variables.
- Instant Calculations: The model automatically recalculates Interactive Brokers' intrinsic value.
- Test Scenarios: Experiment with different assumptions to assess potential valuation shifts.
- Analyze and Decide: Utilize the results to inform your investment or financial analysis.
Why Choose This Calculator for Interactive Brokers Group, Inc. (IBKR)?
- Accurate Data: Up-to-date financial information ensures dependable valuation outcomes.
- Customizable: Tailor essential parameters such as growth rates, WACC, and tax rates to align with your forecasts.
- Time-Saving: Pre-configured calculations save you from starting from the ground up.
- Professional-Grade Tool: Crafted for investors, analysts, and financial consultants.
- User-Friendly: An intuitive design and clear instructions make it accessible for everyone.
Who Should Use This Product?
- Professional Traders: Execute advanced trading strategies with precision using real-time data.
- Institutional Investors: Manage large portfolios efficiently while accessing a wide range of investment products.
- Financial Advisors: Offer clients comprehensive trading solutions and market insights for (IBKR).
- Students and Educators: Learn and teach trading concepts and market analysis using a hands-on approach.
- Market Analysts: Analyze market trends and performance metrics to inform investment decisions.
What the Template Contains
- Pre-Filled Data: Includes Interactive Brokers Group, Inc.'s (IBKR) historical financials and forecasts.
- Discounted Cash Flow Model: Editable DCF valuation model with automatic calculations for (IBKR).
- Weighted Average Cost of Capital (WACC): A dedicated sheet for calculating WACC based on custom inputs for (IBKR).
- Key Financial Ratios: Analyze Interactive Brokers Group, Inc.'s (IBKR) profitability, efficiency, and leverage.
- Customizable Inputs: Edit revenue growth, margins, and tax rates with ease for (IBKR).
- Clear Dashboard: Charts and tables summarizing key valuation results for (IBKR).
Disclaimer
All information, articles, and product details provided on this website are for general informational and educational purposes only. We do not claim any ownership over, nor do we intend to infringe upon, any trademarks, copyrights, logos, brand names, or other intellectual property mentioned or depicted on this site. Such intellectual property remains the property of its respective owners, and any references here are made solely for identification or informational purposes, without implying any affiliation, endorsement, or partnership.
We make no representations or warranties, express or implied, regarding the accuracy, completeness, or suitability of any content or products presented. Nothing on this website should be construed as legal, tax, investment, financial, medical, or other professional advice. In addition, no part of this site—including articles or product references—constitutes a solicitation, recommendation, endorsement, advertisement, or offer to buy or sell any securities, franchises, or other financial instruments, particularly in jurisdictions where such activity would be unlawful.
All content is of a general nature and may not address the specific circumstances of any individual or entity. It is not a substitute for professional advice or services. Any actions you take based on the information provided here are strictly at your own risk. You accept full responsibility for any decisions or outcomes arising from your use of this website and agree to release us from any liability in connection with your use of, or reliance upon, the content or products found herein.