
|
International Seaways, Inc. (INSW) Évaluation DCF |
Entièrement Modifiable: Adapté À Vos Besoins Dans Excel Ou Sheets
Conception Professionnelle: Modèles Fiables Et Conformes Aux Normes Du Secteur
Pré-Construits Pour Une Utilisation Rapide Et Efficace
Compatible MAC/PC, entièrement débloqué
Aucune Expertise N'Est Requise; Facile À Suivre
International Seaways, Inc. (INSW) Bundle
Découvrez la vraie valeur d'International Seaways, Inc. (INSW) avec notre calculatrice DCF de qualité professionnelle! Ajustez les hypothèses clés, explorez divers scénarios et examinez comment les changements affectent la valorisation International Seaways, Inc. (INSW) - le tout dans un modèle Excel facile à utiliser.
What You Will Get
- Editable Excel Template: A fully customizable Excel-based DCF Calculator featuring pre-filled real INSW financials.
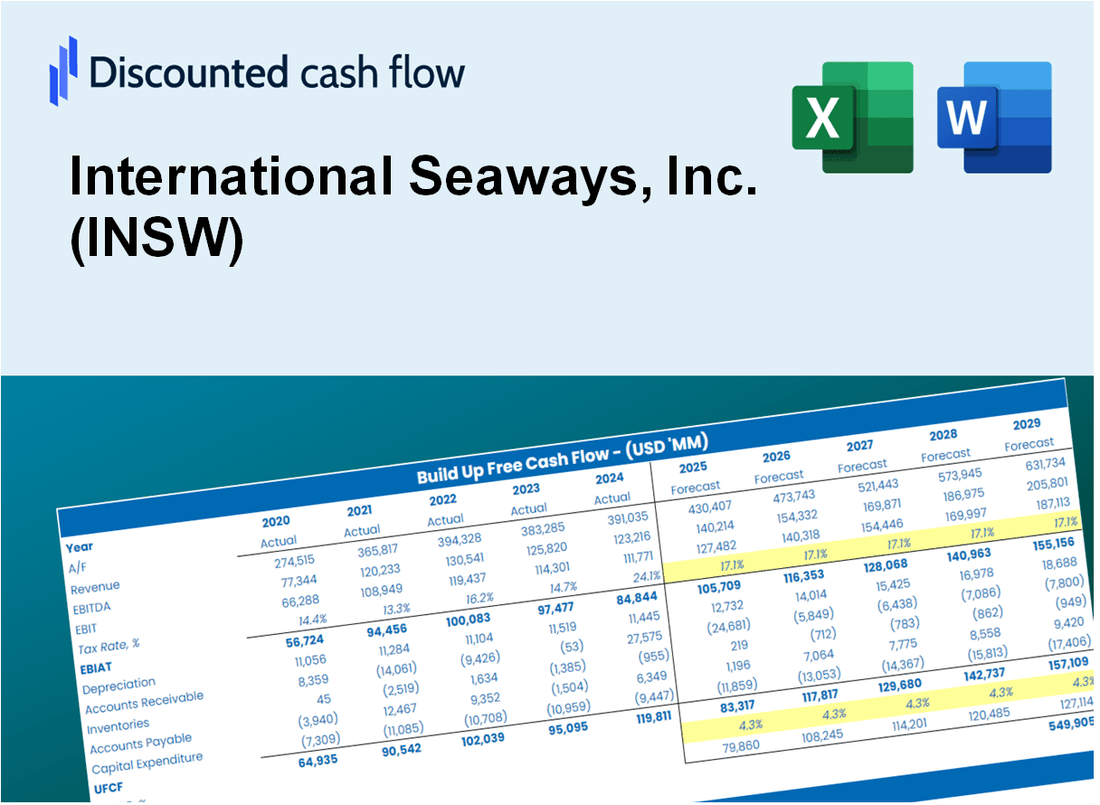
- Real-World Data: Historical data and forward-looking estimates (as highlighted in the yellow cells).
- Forecast Flexibility: Adjust forecast assumptions such as revenue growth, EBITDA %, and WACC.
- Automatic Calculations: Instantly observe the impact of your inputs on International Seaways, Inc.'s valuation.
- Professional Tool: Designed for investors, CFOs, consultants, and financial analysts.
- User-Friendly Design: Organized for clarity and ease of use, complete with step-by-step instructions.
Key Features
- Real-Time INSW Data: Pre-loaded with International Seaways’ historical performance metrics and future outlooks.
- Comprehensive Customization Options: Modify revenue growth rates, profit margins, discount rates, tax considerations, and capital investments.
- Interactive Valuation Framework: Automatically refreshes Net Present Value (NPV) and intrinsic value in response to your adjustments.
- Scenario Analysis: Generate various forecasting scenarios to explore different valuation possibilities.
- Intuitive User Interface: Designed for ease of use, catering to both seasoned professionals and newcomers.
How It Works
- Step 1: Download the prebuilt Excel template featuring International Seaways, Inc. (INSW) data.
- Step 2: Navigate through the pre-filled sheets to familiarize yourself with the essential metrics.
- Step 3: Modify forecasts and assumptions in the editable yellow cells (WACC, growth, margins).
- Step 4: Instantly view updated results, including the intrinsic value of International Seaways, Inc. (INSW).
- Step 5: Make well-informed investment decisions or create reports based on the outputs.
Why Choose This Calculator for International Seaways, Inc. (INSW)?
- User-Friendly Interface: Crafted for both novice users and seasoned professionals.
- Customizable Inputs: Adjust parameters easily to suit your financial analysis needs.
- Real-Time Valuation: Observe immediate updates to International Seaways’ valuation as you modify inputs.
- Preloaded Data: Comes with International Seaways’ actual financial metrics for swift evaluations.
- Relied Upon by Experts: Favored by investors and analysts for making strategic decisions.
Who Should Use International Seaways, Inc. (INSW)?
- Investors: Gain insights into the maritime transportation sector with a reliable investment tool.
- Financial Analysts: Streamline your analysis with comprehensive data and metrics specific to the shipping industry.
- Consultants: Effortlessly tailor reports and presentations for clients in the logistics and shipping fields.
- Maritime Enthusiasts: Enhance your knowledge of the shipping market through detailed performance analysis.
- Educators and Students: Utilize it as a resource for understanding maritime economics in academic settings.
What the Template Contains
- Operating and Balance Sheet Data: Pre-filled International Seaways, Inc. (INSW) historical data and forecasts, including revenue, EBITDA, EBIT, and capital expenditures.
- WACC Calculation: A dedicated sheet for Weighted Average Cost of Capital (WACC), featuring parameters like Beta, risk-free rate, and share price.
- DCF Valuation (Unlevered and Levered): Editable Discounted Cash Flow models displaying intrinsic value with comprehensive calculations.
- Financial Statements: Pre-loaded financial statements (annual and quarterly) to facilitate analysis.
- Key Ratios: Includes profitability, leverage, and efficiency ratios for International Seaways, Inc. (INSW).
- Dashboard and Charts: Visual summary of valuation outputs and assumptions to simplify result analysis.
Disclaimer
All information, articles, and product details provided on this website are for general informational and educational purposes only. We do not claim any ownership over, nor do we intend to infringe upon, any trademarks, copyrights, logos, brand names, or other intellectual property mentioned or depicted on this site. Such intellectual property remains the property of its respective owners, and any references here are made solely for identification or informational purposes, without implying any affiliation, endorsement, or partnership.
We make no representations or warranties, express or implied, regarding the accuracy, completeness, or suitability of any content or products presented. Nothing on this website should be construed as legal, tax, investment, financial, medical, or other professional advice. In addition, no part of this site—including articles or product references—constitutes a solicitation, recommendation, endorsement, advertisement, or offer to buy or sell any securities, franchises, or other financial instruments, particularly in jurisdictions where such activity would be unlawful.
All content is of a general nature and may not address the specific circumstances of any individual or entity. It is not a substitute for professional advice or services. Any actions you take based on the information provided here are strictly at your own risk. You accept full responsibility for any decisions or outcomes arising from your use of this website and agree to release us from any liability in connection with your use of, or reliance upon, the content or products found herein.