
|
Innospec Inc. (IOSP) Évaluation DCF |
Entièrement Modifiable: Adapté À Vos Besoins Dans Excel Ou Sheets
Conception Professionnelle: Modèles Fiables Et Conformes Aux Normes Du Secteur
Pré-Construits Pour Une Utilisation Rapide Et Efficace
Compatible MAC/PC, entièrement débloqué
Aucune Expertise N'Est Requise; Facile À Suivre
Innospec Inc. (IOSP) Bundle
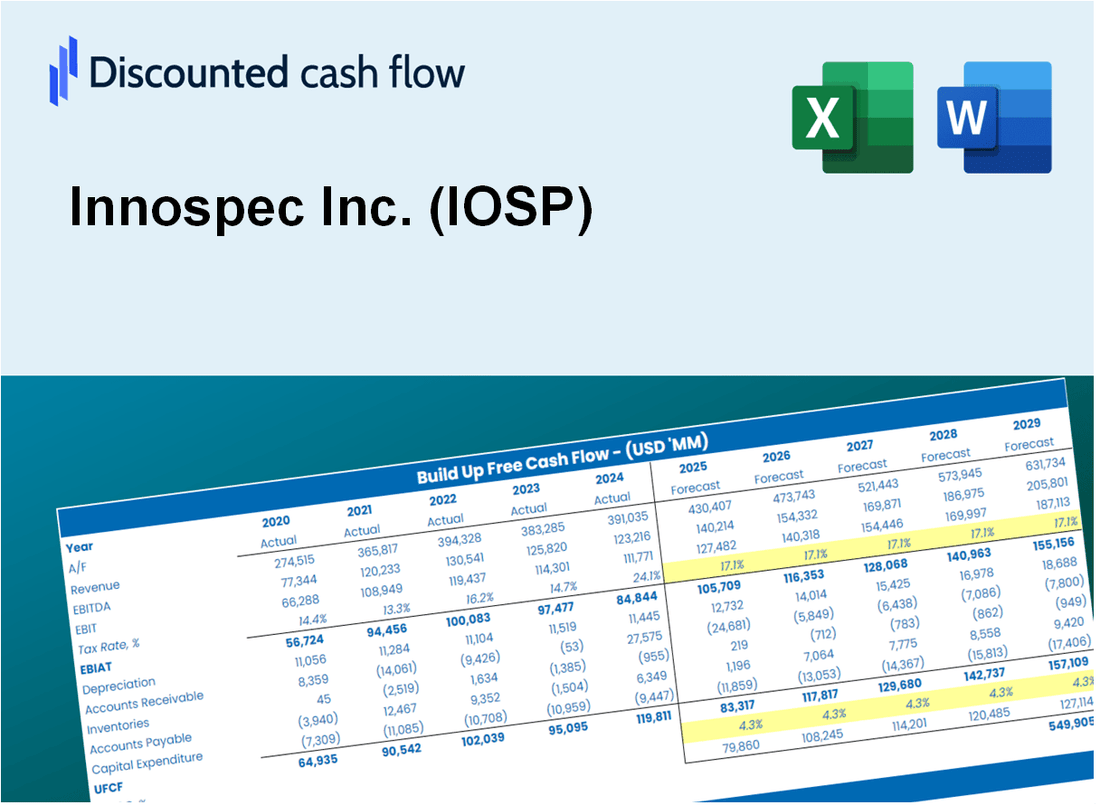
Simplifiez l'évaluation Innospec Inc. (IOSP) avec cette calculatrice DCF personnalisable! Doté de Real Innospec Inc. (IOSP) et des intrants de prévision ajustés, vous pouvez tester les scénarios et découvrir la juste valeur Innospec Inc. (IOSP) en procès-verbal.
What You Will Receive
- Authentic Innospec Data: Preloaded financials – encompassing revenue to EBIT – derived from actual and projected figures.
- Comprehensive Customization: Modify all essential parameters (yellow cells) such as WACC, growth %, and tax rates.
- Immediate Valuation Updates: Automatic recalculations to assess the impact of changes on Innospec’s fair value.
- Flexible Excel Template: Designed for quick edits, scenario analysis, and in-depth projections.
- Efficient and Precise: Avoid the hassle of building models from scratch while ensuring accuracy and adaptability.
Key Features
- Comprehensive DCF Calculator: Features detailed unlevered and levered DCF valuation models tailored for Innospec Inc. (IOSP).
- WACC Calculator: Pre-configured Weighted Average Cost of Capital sheet with adjustable parameters specific to Innospec Inc. (IOSP).
- Customizable Forecast Assumptions: Adjust growth rates, capital expenditures, and discount rates to fit Innospec Inc. (IOSP) projections.
- Integrated Financial Ratios: Evaluate profitability, leverage, and efficiency ratios relevant to Innospec Inc. (IOSP).
- Interactive Dashboard and Charts: Visual representations summarize essential valuation metrics for straightforward analysis of Innospec Inc. (IOSP).
How It Works
- Download the Template: Gain immediate access to the Excel-based Innospec Inc. (IOSP) DCF Calculator.
- Input Your Assumptions: Modify the yellow-highlighted cells for growth rates, WACC, margins, and additional parameters.
- Instant Calculations: The model automatically recalculates Innospec Inc.'s (IOSP) intrinsic value.
- Test Scenarios: Explore various assumptions to see how they impact potential valuation changes.
- Analyze and Decide: Leverage the results to inform your investment or financial analysis.
Why Choose This Calculator for Innospec Inc. (IOSP)?
- Comprehensive Tool: Features DCF, WACC, and financial ratio analyses all in one convenient package.
- Customizable Inputs: Modify yellow-highlighted cells to explore different financial scenarios.
- Detailed Insights: Automatically computes Innospec’s intrinsic value and Net Present Value.
- Preloaded Data: Historical and projected data provide reliable starting points for analysis.
- Professional Quality: Perfect for financial analysts, investors, and business consultants focused on (IOSP).
Who Should Use This Product?
- Professional Investors: Develop comprehensive and accurate valuation models for assessing Innospec Inc. (IOSP) investments.
- Corporate Finance Teams: Evaluate valuation scenarios to inform strategic decisions within the company.
- Consultants and Advisors: Deliver precise valuation insights related to Innospec Inc. (IOSP) to clients.
- Students and Educators: Utilize real-world data to enhance learning and practice in financial modeling.
- Industry Analysts: Gain insights into the market valuation of specialty chemicals companies like Innospec Inc. (IOSP).
What the Template Contains
- Historical Data: Includes Innospec Inc.'s (IOSP) past financials and baseline forecasts.
- DCF and Levered DCF Models: Detailed templates to calculate Innospec Inc.'s (IOSP) intrinsic value.
- WACC Sheet: Pre-built calculations for Weighted Average Cost of Capital.
- Editable Inputs: Modify key drivers like growth rates, EBITDA %, and CAPEX assumptions.
- Quarterly and Annual Statements: A complete breakdown of Innospec Inc.'s (IOSP) financials.
- Interactive Dashboard: Visualize valuation results and projections dynamically.
Disclaimer
All information, articles, and product details provided on this website are for general informational and educational purposes only. We do not claim any ownership over, nor do we intend to infringe upon, any trademarks, copyrights, logos, brand names, or other intellectual property mentioned or depicted on this site. Such intellectual property remains the property of its respective owners, and any references here are made solely for identification or informational purposes, without implying any affiliation, endorsement, or partnership.
We make no representations or warranties, express or implied, regarding the accuracy, completeness, or suitability of any content or products presented. Nothing on this website should be construed as legal, tax, investment, financial, medical, or other professional advice. In addition, no part of this site—including articles or product references—constitutes a solicitation, recommendation, endorsement, advertisement, or offer to buy or sell any securities, franchises, or other financial instruments, particularly in jurisdictions where such activity would be unlawful.
All content is of a general nature and may not address the specific circumstances of any individual or entity. It is not a substitute for professional advice or services. Any actions you take based on the information provided here are strictly at your own risk. You accept full responsibility for any decisions or outcomes arising from your use of this website and agree to release us from any liability in connection with your use of, or reliance upon, the content or products found herein.